
.webp)
.webp)


TikTok Statistics: Key Insights for 2026
According to our TikTok Statistics research data, TikTok has close to 2 billion monthly active users worldwide as of 2026. It is definitely among the top social media platforms by global reach.
User engagement also remains exceptionally high. On average, TikTok users spend around 95 minutes per day on the app, which is significantly more than on most competing platforms. Such a level of attention has continued to prompt brands and creators to invest heavily in TikTok.
On the business side, TikTok revenue has crossed $20 billion globally, fueled by advertising, TikTok Shop, and in-app purchases. With this scale and growth, understanding how many people use TikTok, usage patterns, and regional trends is essential for anyone looking to succeed on the platform in 2025.
TikTok at a Glance: Key Statistics (2026 Snapshot)
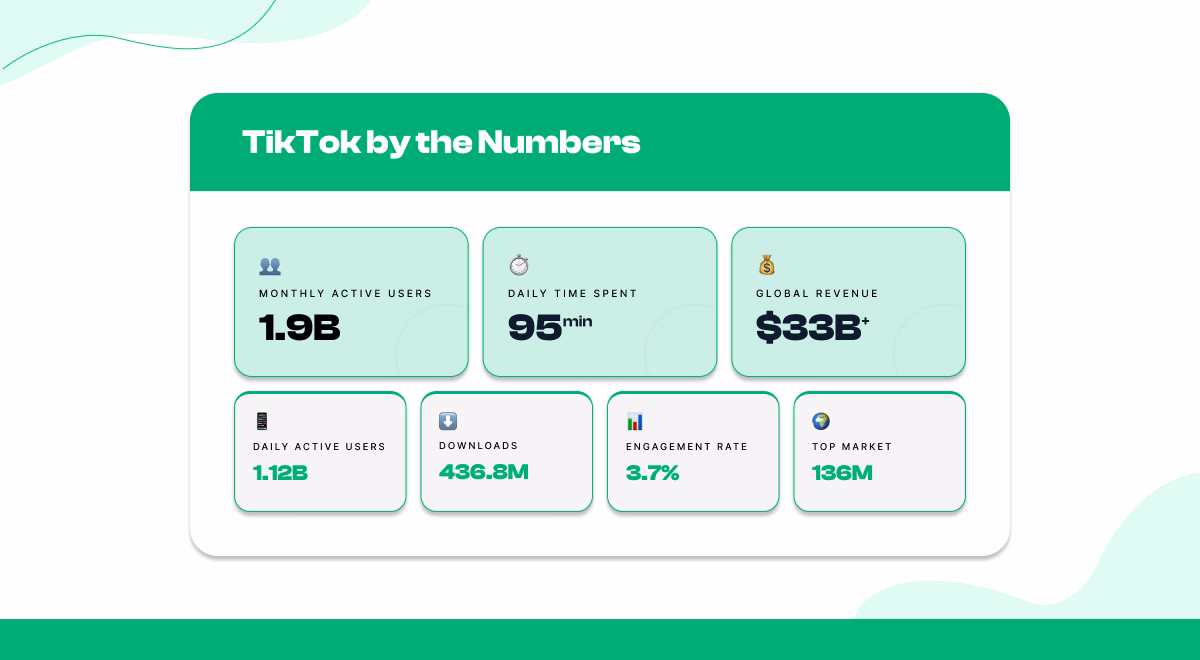
- 1.9 billion of active monthly users.
- 1.12 billion of daily active users.
- On average, every user spends 95 minutes a day on the platform.
- Global App Downloads are around 436.8 million (first half 2025)
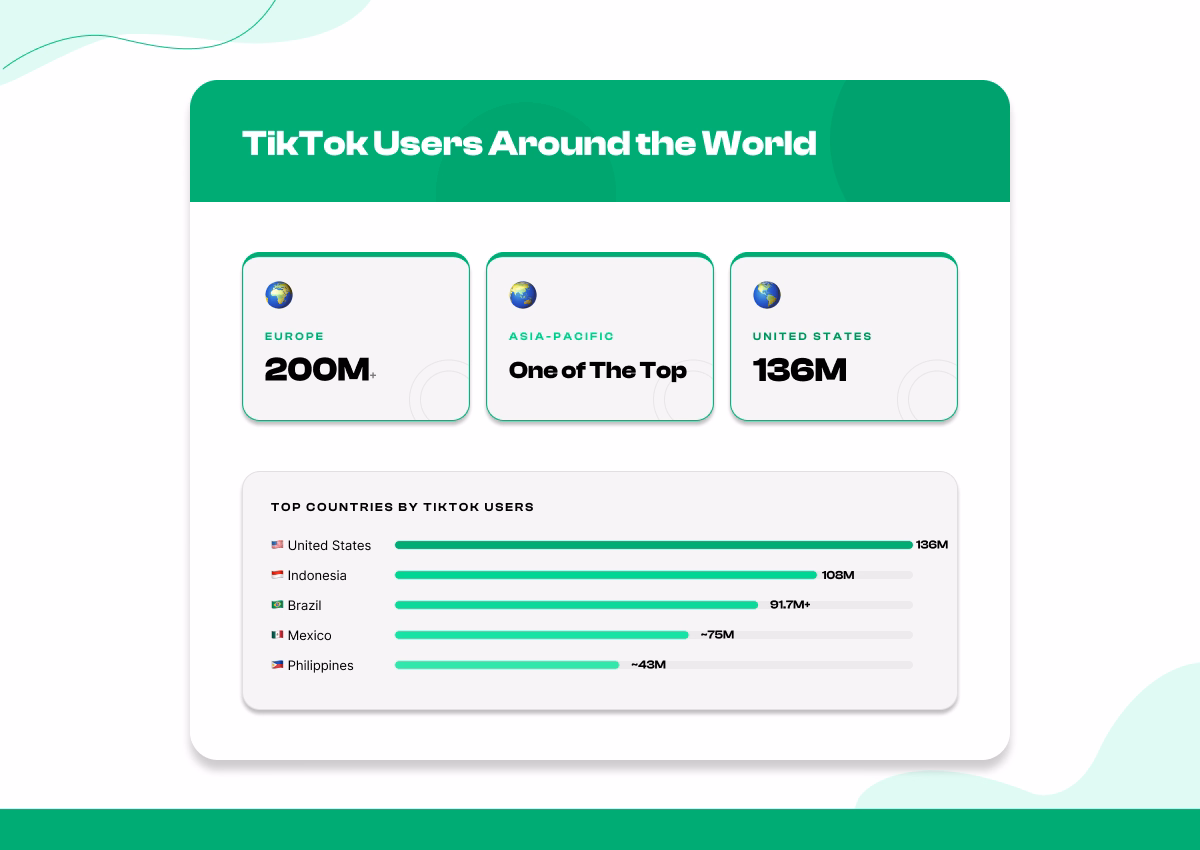
- US (136M), Indonesia (108M), and Brazil (91.7M+) are the countries with the largest user bases
- In 2024, the annual revenue was $23 B, and in 2025 it was $33 B+
- TikTok Engagement Rate was 3.7 % (2026 benchmark) (Social Insider)
TikTok User Statistics & Growth Trends
Let’s have a look at some user statistics and growth trends on the platform.
Total TikTok Users Worldwide (2020 - 2026)
TikTok Users by Country
The US is reigning TikTok champion in terms of user base size, but it's certainly not alone in its enthusiasm for the platform.
Let's take a look at the top 10 countries by TikTok usage.
Top 10 Countries by TikTok Users - 2026
TikTok App Downloads Statistics
TikTok surpassed a total of around 5.48 billion lifetime downloads as of 2025 across all platforms.
iOS vs Android Split:
TikTok Demographics Statistics
Understanding TikTok’s audience helps creators and brands tailor content and campaigns effectively.
TikTok Age Distribution
Here’s how TikTok users are distributed across age groups globally as of 2025–2026 (data varies slightly by source, but patterns are consistent):
Adults aged 25–34 currently represent the largest share of TikTok’s user base in 2026, indicating the platform’s appeal beyond its early Gen Z roots.
Meanwhile, younger users (13–24) still make up a significant portion, but older groups (35+) are growing steadily.
TikTok Gender Demographics
Here’s how TikTok’s global gender split looks as of the latest data:
Globally, TikTok leans slightly male, though regional splits can differ significantly (for example, the U.S. has more female users).
TikTok Usage Statistics by Region
While precise up-to-date regional numbers vary, recent reporting shows:
- Europe: Over 200 million monthly active TikTok users as of late 2025, a growing share of the continent’s online population.
- Asia-Pacific: Constitutes one of the largest regional user bases globally, with countries like Indonesia and others leading adoption.
- United States: One of TikTok’s single largest markets with tens of millions of users.
Across regions, age and gender patterns can shift. For example, North America tends to skew slightly older than Southeast Asia, but young adults (18–34) remain dominant across most markets.
Penetration Rate by Country
TikTok's reach looks wild when you break it down by country. Some places show penetration rates over 100%. Yes, that's possible. People run multiple accounts.
By early 2026, the Middle East and Southeast Asia lead the pack. The U.S. still has the most users overall, just not the highest percentage.
Where TikTok Owns the Market (Adults 18+)
We're talking about the share of adults using the app in each country.
Who's Watching Where
Mid-2025 showed this breakdown for TikTok's ad audience:
TikTok Engagement Statistics
Now it’s time to look at some TikTok engagement stats.
Average Time Spent & Usage Patterns
TikTok users spend a significant amount of time on the app daily, making it one of the most engaging social platforms worldwide:
- Average time spent per day: around 95 minutes across all users globally, higher than Instagram and other competitors.
- Average sessions per day: Users open TikTok approximately 14–19 times daily, with each session lasting around 10.6 minutes.
Platform comparison (daily time)
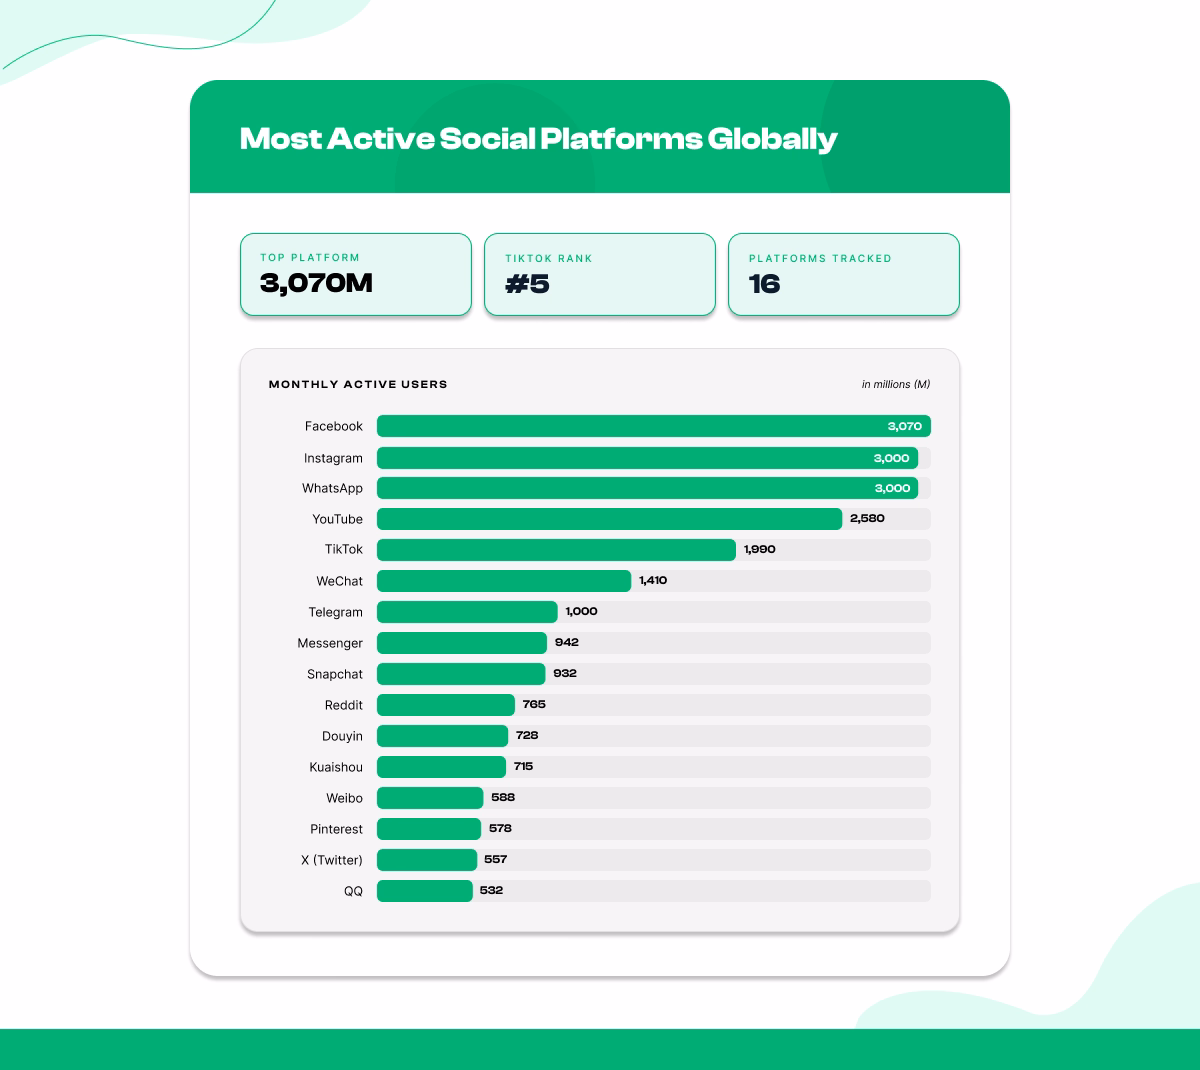
Most popular social networks with monthly active users
TikTok Engagement Rate Benchmarks
Engagement on TikTok varies by follower size and creator type.
Here are typical benchmarks:
By Account Tier
Smaller creators, especially, tend to enjoy higher engagement rates as their audiences interact more often with content.
Overall, TikTok’s average engagement tends to fall around approximately 2.5–4.9% across accounts in 2025, which generally exceeds many other platforms.
Platform Comparison:
Content Creation vs. Consumption
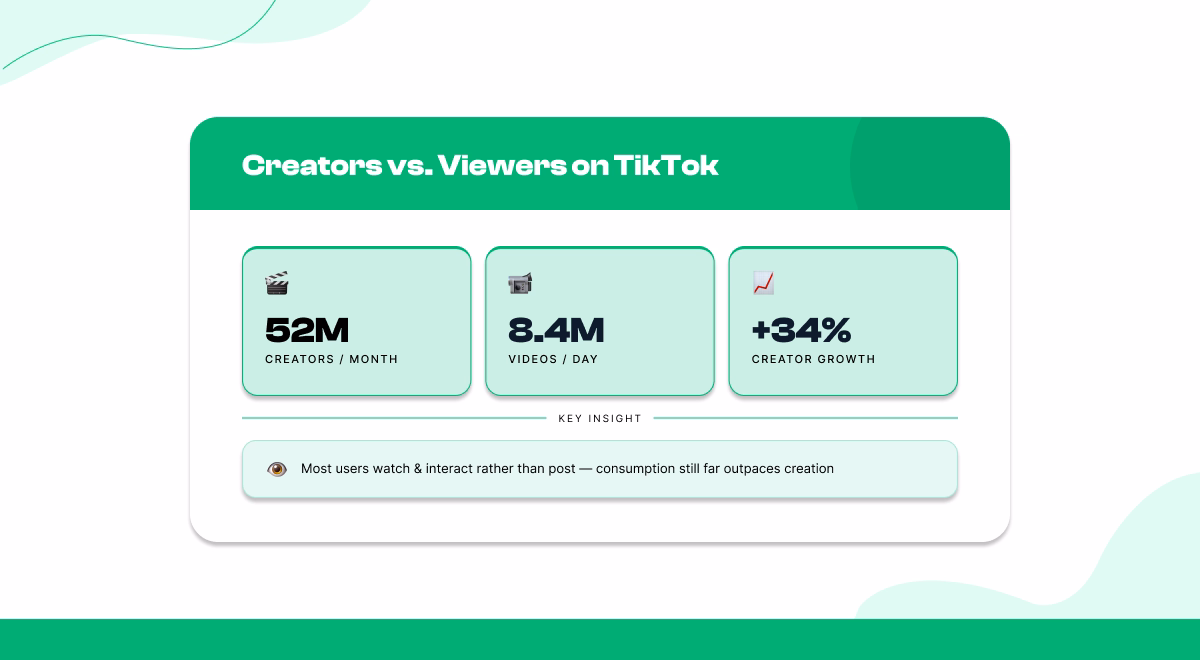
TikTok isn’t just for passive viewing. Millions contribute content here.
Content creation is widespread, but many users still primarily consume content. They watch and interact rather than posting.
TikTok Revenue & Financial Statistics
TikTok’s financial performance continues to grow rapidly as the platform expands its monetization avenues.
Annual Revenue Growth
Revenue Per User & Market Value
Average revenue per user: Around $12.35 annually as of 2025 estimates. TikTok’s revenue model blends ads, e-commerce, and creator monetization to diversify income and support long-term growth.
Regional Impact: The U.S. remains a top market, contributing a significant share of advertising dollars.
TikTok Creator Earnings Statistics
The Creator Rewards Program now pays $0.40 to $1.00+ for every 1,000 qualified views. That's a huge jump from the old Creator Fund, which paid a measly $0.02 to $0.04 per 1,000 views.
The creator economy on TikTok is worth over $37 billion in 2026.
What You Can Actually Earn (2025–2026)
You need 10k+ followers, 100k+ views in 30 days, and videos over 1 minute long to join the creator rewards program. Then you get $0.40 to $1.00+ per 1,000 views.
Charli D'Amelio is projected to make $17.5 million in 2026.
TikTok creators pulled in $4.1 billion in 2024. It depends on the engagement. TikTok's engagement rate sits at 3.70%. Instagram is just 0.48%, and Facebook comes at a tiny 0.15%.
If you have 100k to 500k followers, brands will pay you $2,000+ per post.
How Creators Make Money
What Different Creators Earn Per Post
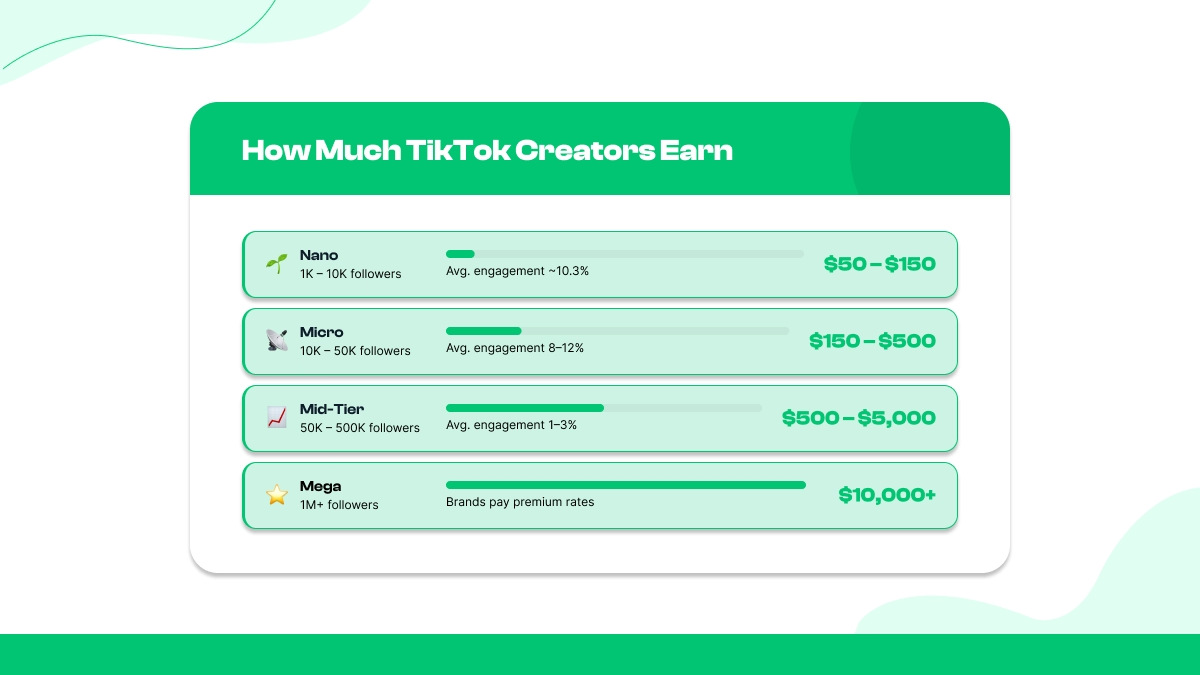
- Nano-influencers (1k–10k followers): $50 to $150
- Micro-influencers (10k–50k followers): $150 to $500
- Mid-tier influencers (50k–500k followers): $500 to $5,000
- Mega-influencers (1M+ followers): $10,000+
TikTok Content Trends & Category Statistics
Understanding content trends and having a thorough knowledge of category stats can help you make conscious content decisions as a creator on TikTok.
Most Popular TikTok Content Categories
Below are some of the most viewed content themes on TikTok, based on hashtag view data and engagement trends:
While entertainment and dance remain the most dominant categories, beauty, fashion, and educational content have carved out significant engagement niches.
Meanwhile, high engagement in tutorials and fitness reflects diversified interests beyond pure entertainment.
3 Trends That Drive Engagement
Although precise global metrics vary by dataset, several consistent patterns have emerged:
- Trending Sounds & Viral Audio
A large majority of viral videos use trending sounds; tracks that circulate widely and get reused in many creations. TikTok continues to turn songs into mainstream hits thanks to repeated use in user clips.
- Challenge Participation
Hashtag challenges and branded movements generate massive view counts; branded hashtag challenges often reach billions of views and encourage mass participation.
For example, hashtag challenge participation can average 8.5 billion views on high-performing campaigns, indicating how collective trends fuel engagement.
- Trend Lifespan
TikTok trends can evolve rapidly, with some lasting weeks or months and continuing to engage niches over time. Many fashion, music, or lifestyle trends documented for early 2026 show substantial week-over-week growth.
Posting Frequency and Timing
While exact timing strategies vary with audience and niche, general patterns suggest:
Frequent posting (3–5 times per week) maximizes engagement and algorithmic visibility. And if you post during peak user hours (evenings local time), it will align with when users are most active.
Also, if trend integration, such as sounds and challenges, is timed close to peak trend moments, it will improve reach.
TikTok’s Role in Marketing
The world of marketing has changed since TikTok’s inception.
Brand Adoption on TikTok
TikTok has rapidly evolved into a mainstream marketing channel-
- Percentage of brands using TikTok: TikTok’s ad platform captured roughly 12 % of total U.S. social advertising spend in 2025, showing strong brand adoption across markets.
- SMB vs Enterprise usage: Both small- to medium-sized businesses (SMBs) and large enterprises are investing in TikTok ads. Creative, trend-driven content appeals to SMBs for cost-efficient reach, while enterprises leverage broad targeting and premium placements like TopView.
- Industry adoption: Retail, beauty, food & beverage, and technology sectors have some of the most active TikTok ad engagement, with e-commerce and branded hashtag challenges driving significant user interaction.
Across industries, TikTok’s mix of creative formats, strong engagement, and young-to-mid-age audiences makes it a compelling platform for digital marketing strategies.
TikTok Ad Performance Benchmarks
Here are key advertising performance metrics for TikTok based on recent 2025–2026 data:
TikTok Ad Cost Metrics
Platform Comparisons
TikTok’s CPM tends to be lower than Meta’s (for example: $7.03 vs ~$12.53) while still delivering broad reach. Meanwhile, average CPC on TikTok is generally below Meta and competitive with YouTube, making clicks more cost-effective.
At the same time, CTR rates on TikTok are solid, often outperforming other social platforms in engagement-oriented campaigns.
Engagement Performance vs Meta & YouTube
TikTok often yields higher engagement rates (2.6%+) than platforms like YouTube Shorts or Instagram in similar campaign types.
Although direct conversion benchmarks vary by sector, TikTok generally excels at early-funnel engagement and awareness, especially for younger audiences.
TikTok Influencer Marketing Statistics
Influencer marketing is a massive part of the platform’s ecosystem.
Influencer Impact on Purchase Behavior
On TikTok, creator influence can directly affect buying decisions.
- High Influence on Purchases: A large share of TikTok users make purchasing decisions after seeing products on the platform. Reports indicate that over 70 % of TikTok users have purchased something after seeing it in their feed, showing strong influencer-driven buying behavior.
- Trust Over Traditional Ads: Influencer content on TikTok often feels more relatable and trustworthy compared with traditional paid ads. Industry insights show that 92% of consumers trust recommendations from individuals (like influencers) more than direct brand ads, boosting the effectiveness of influencer campaigns.
- Community Credibility: Smaller creators are often seen as peers or niche experts, which increases the likelihood that followers act on their recommendations, whether it’s trying a product, downloading an app, or signing up for a service.
Nano vs Micro vs Macro Influencer Performance
Influencer performance on TikTok varies widely depending on audience size, engagement, and cost, often favoring smaller, more authentic creators:
Engagement Comparison (2025 benchmarks)
- Nano-Influencers (1K–10K): Average engagement rates around 10.3 %, significantly higher than larger tiers.
- Micro-Influencers (10K–100K): Strong engagement of 8–12 %, balancing reach and audience interaction.
- Macro-Influencers (100K–1M): Lower engagement, often 1–3 %, due to broader but less niche audiences.
- Mega-Influencers (1M+): Engagement continues to decrease as follower count grows, often less efficient for niche engagement.
Cost Efficiency and ROI
Nano & Micro: These tiers are more cost-effective, delivering strong engagement and higher ROI per dollar spent. For example, nano and micro influencers often cost far less per post than macro or celebrity creators while delivering a deeper audience connection.
Macro & Mega: Although they offer broad reach, their engagement and conversion efficiency tend to be lower. This means more money spent with comparatively less impact per dollar.
Why Smaller Creators Often Win
Nano and micro influencers typically maintain tighter community bonds and personal credibility, leading to higher engagement and conversion performance than larger influencers whose audiences may include more passive followers.
Many brands now prioritize working with smaller-tier creators because they unlock niche audiences and generate more action-oriented engagement — such as comments, shares, and purchases.
TikTok Video Statistics
As a TikToker, having profound knowledge of video stats can help you define your content strategy.
Video Length and Performance
TikTok continues to evolve beyond ultra-short clips, and performance data shows nuanced trends for different lengths of video content:
Average Completion and Reach by Video Length (2025–2026):
- 0–15 seconds: 92% completion; 35% of total views, short clips keep attention high.
- 16–30 seconds: 84% completion; 28% of total views, still a strong performance.
- 31–60 seconds: 68% completion; 22% of total views, deeper content with high engagement.
- 1–3 minutes: 42% completion; 12% of total views, longer storytelling pays dividends for likes.
- 3+ minutes: 28 % completion; fewer overall views but rising likes per post.
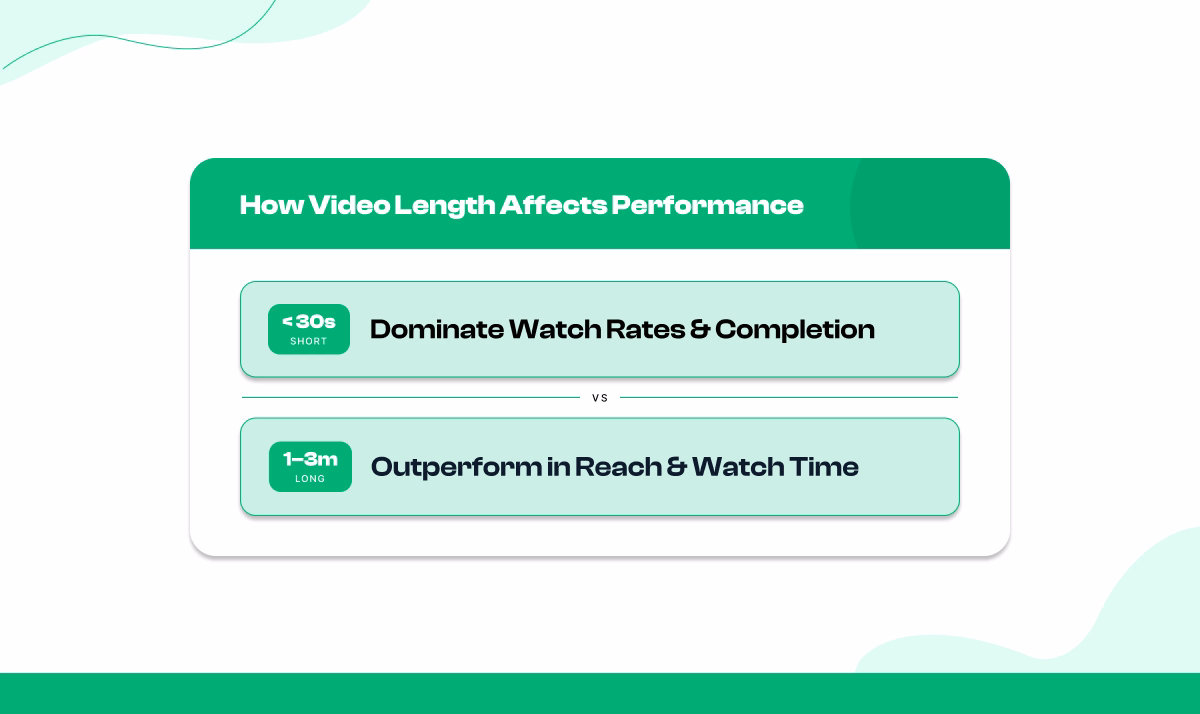
Key Insights
Videos under 30 seconds dominate watch rates and completion, especially for broad visibility. That said, content between 60 and 180 seconds often outperforms shorter clips in reach and watch time when it maintains viewer interest.
Average engagement rates for slightly longer videos (over 54 seconds) can reach 6.7 %, indicating deeper viewer interaction for more detailed content.
Features That Boost Engagement
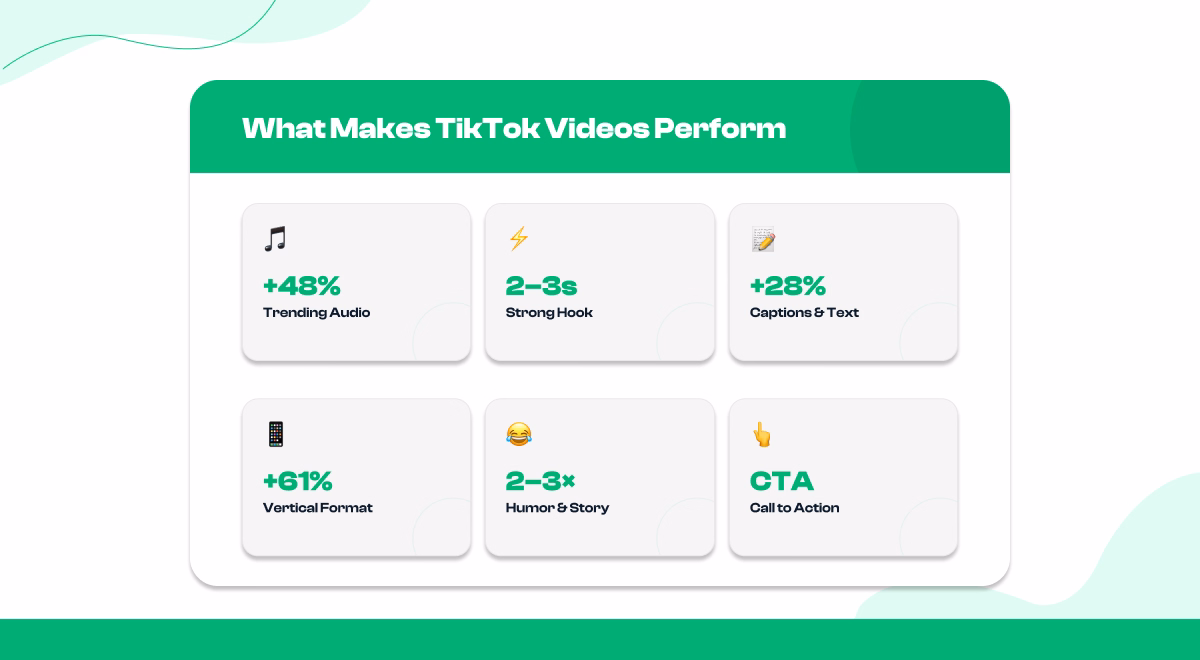
Certain video features and refinements are strongly associated with higher interaction and visibility on TikTok:
Top Performance Boosters
TikTok Algorithm Insights
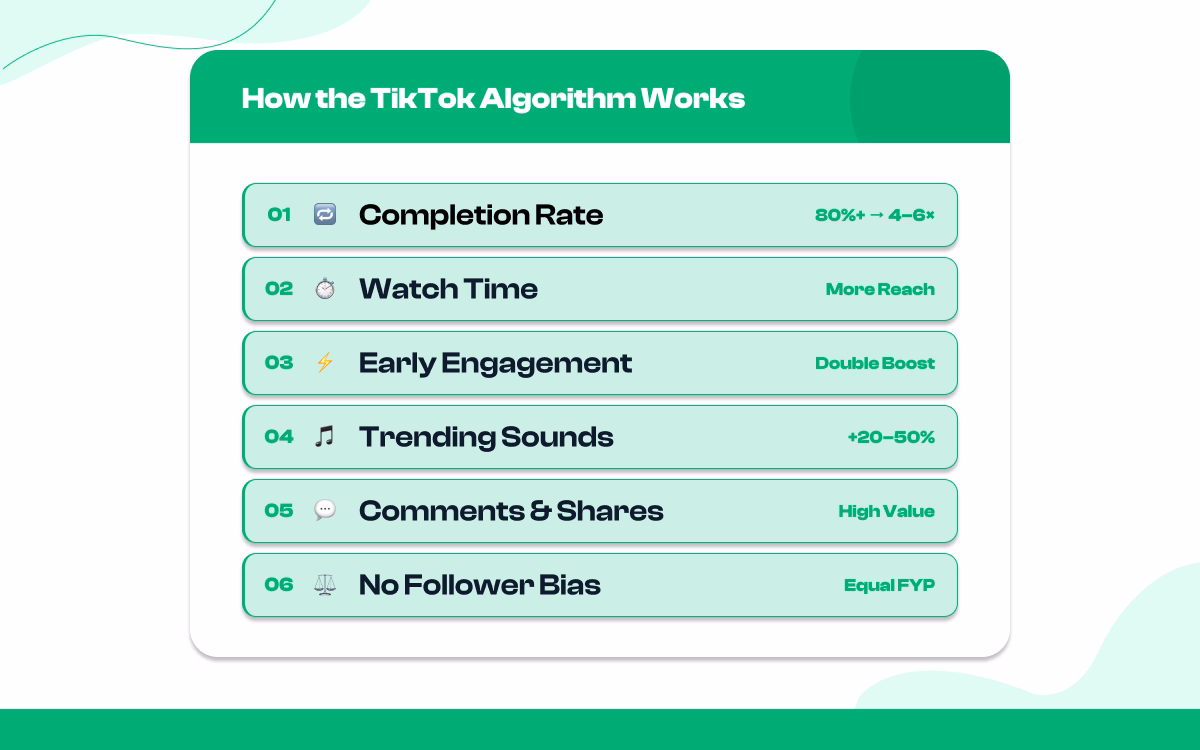
TikTok’s algorithm places heavy emphasis on multiple viewing behavior metrics rather than just raw view counts:
Core Algorithm Signals (2025–2026)
Completion rate: Videos with 80 %+ completion are up to 4–6× more likely to be recommended widely.
Watch time: Holding viewer attention longer significantly increases distribution potential.
Early engagement: Strong signals (likes/comments/shares) in the first 15–60 minutes trigger broader reach boosts.
Trending sounds: Using current popular audio can boost reach by ~20–50 % when relevant.
User interaction signals: Comments and shares often weigh more than likes for longterm distribution.
No follower bias: TikTok’s system doesn’t prioritize large accounts; content relevance and engagement determine momentum.
Discovery Dynamics: Most content is surfaced via the For You Page (FYP), with algorithms testing new videos on small audiences before amplification.
These algorithm insights show why TikTok rewards viewer behaviour, particularly retention and interaction, and why creators of all sizes can succeed when content resonates.
TikTok E-Commerce & TikTok Shopping Statistics
TikTok’s built-in commerce features like TikTok Shop are reshaping how people discover and buy products online.
Below are the most recent, verified TikTok Shop statistics and social commerce insights that highlight the platform’s growing role in digital retail.
TikTok Shop Adoption & Growth
Let’s have a look at the adoption and growth process of the TikTok shop.
Rapid Growth & Market Share
Regional Differences
TikTok Shop’s U.S. business began in September 2023 and is growing rapidly, attracting both large brands and independent sellers.
In other regions (e.g., UK), 200,000+ small and medium businesses are now selling through TikTok Shop, often using livestreams and creator content to drive conversions.
Social Commerce Market Position
TikTok Shop’s share is expected to climb further, projected to reach over 24 % of U.S. social commerce by 2027.
TikTok Shopping User Behavior
User behavior can be a massive factor.
Product Discovery & Conversion
Studies suggest up to 83 % of TikTok Shop users discover new brands or products through the platform.
TikTok’s algorithm-driven feeds help surface products naturally within video content, shortening the path from discovery to purchase more effectively than many competing social commerce channels.
Average Order Value & Purchase Frequency
Average order values on TikTok Shop vary by region, but reported estimates range from $35 up to ~$63, depending on product mix and buying behaviors.
In some regions and during key campaigns, marketplaces show high conversion from content to sale, with users making multiple purchases per month. For instance, nearly half of TikTok shoppers buy at least once a month.
Live Shopping & Interactive Commerce
TikTok’s live shopping streams are an emerging conversion driver, often yielding high engagement and conversion, especially in markets where livestream commerce is deeply rooted. For example, live shopping in regions like the UK and Asia is increasingly integrated into TikTok’s commerce flow.
Impulse & Repeat Buying Patterns
Data suggests users tend toward impulse buying on TikTok Shop more than on many traditional channels, with some markets reporting higher repeat purchase rates than other social or non-social ecommerce sites.
TikTok Analytics and Performance Tracking
Tracking performance on TikTok is essential for creators and marketers to understand what’s working, refine strategies, and measure real impact, especially if you’re running both organic content and paid ads or TikTok Shop campaigns. The right data helps you make smart decisions, improve reach, and optimise return on investment (ROI).
Key Metrics to Monitor
To truly understand TikTok performance, focus on metrics across reach, engagement, audience, retention, and conversions:
Reach & Visibility
The primary factors regarding reach and visibility are-
- Video Views: How many times your video was watched.
- Impressions: Number of times your content appeared. It’s helpful to measure top-of-funnel visibility.
- Profile Visits: Indicates discovery interest beyond specific posts.
- Traffic Sources: Shows where views came from (For You Page, hashtags, profile, etc.).
Engagement Metrics
The TikTok engagement metrics are-
- Likes, Comments, Shares: Core indicators of viewer interaction.
- Engagement Rate: Interactions as a percentage of views or audience size.
- Saves: Suggests content viewers want to revisit.
Retention & Watch Time
Key metrics are-
- Average Watch Time: How long viewers stay watching — a key signal for TikTok’s algorithm.
- Completion Rate: % of viewers who watch the video all the way through.
- Replays: Suggest strong interest or highly replayable content.
Audience & Growth
You can understand your audience and growth through-
- Follower Growth: Tracks new followers over time.
- Audience Demographics: Insight into viewer age, gender, and location to tailor content.
- Follower Activity: When your audience is most active.
Conversions & Business Impact
You can measure business impact through-
- Click-Through Rate (CTR): Especially critical for campaigns driving external traffic.
- Conversion Metrics: For TikTok Shop or ads, this includes purchase or lead events.
- TikTok Shop Orders & Website Visits: Metrics that show real business impact.
Understanding these metrics helps align performance with goals, whether it’s brand awareness, community engagement, sales, or TikTok growth.
Tools for Analysis
While TikTok’s native analytics dashboard provides first-party data (best for basic metrics), third-party tools help marketers and creators dig deeper and create reports that are easier to understand and share:
Top Analytics Tools
- Sotrender: Tracks content performance, engagement, reach, and audience metrics, which is great for teams and agencies.
- Porter Metrics / Supermetrics: Lets you pull TikTok data into Google Sheets or BI dashboards for custom reporting and deeper trend analysis.
- Analisa: AI-driven insights into TikTok account performance, audience behaviour, and growth trends.
- Pentos: Measures trends and performance over time, including hashtags and competitor analysis.
- HypeAuditor, Social Insider, and Talkwalker: Offer cross-platform analytics, sentiment tracking, and benchmarking against competitors.
Most tools provide custom dashboards, competitive benchmarks, and trend insights not available in TikTok’s built-in dashboard.
ROI Tracking for Marketers
Measuring return on investment (ROI) is crucial when you’re investing in TikTok ads or ecommerce initiatives like TikTok Shop. These practices help tie performance data to real business outcomes:
Set Up Conversion Tracking
TikTok Pixel: Install on your website to track post-click actions like product views, add-to-cart, and purchases. This connects ad performance directly with conversions and ROAS (Return on Ad Spend).
TikTok Events API: A server-side tracking solution to capture conversion events more reliably (useful where cookie tracking faces limitations).
Measure Core ROI Metrics
ROAS (Return on Ad Spend): Revenue generated per dollar spent on TikTok ads.
Cost per Result: Cost per conversion event (e.g., purchase or lead).
Conversion Rate: Percent of clicks that translate into sales or desired actions.
Click-Through Rate (CTR) and Engagement: Early indicators of campaign effectiveness.
Cross-Platform Tracking
Importing TikTok ad cost data into tools like Google Analytics or GA4 will allow you to compare spend and outcomes across platforms. From this, you can give a fuller picture of ROI across your digital marketing mix.
Final Tip
Regularly reviewing analytics and performance trends will help you-
- Identify what content resonates most
- Adjust posting schedules and formats
- Improve targeting for ads and TikTok Shop initiatives
- Report ROI and performance to stakeholders clearly and confidently
If tracked consistently and interpreted correctly, TikTok analytics become a powerful strategic advantage.
5 Actionable Tips Based on TikTok Statistics
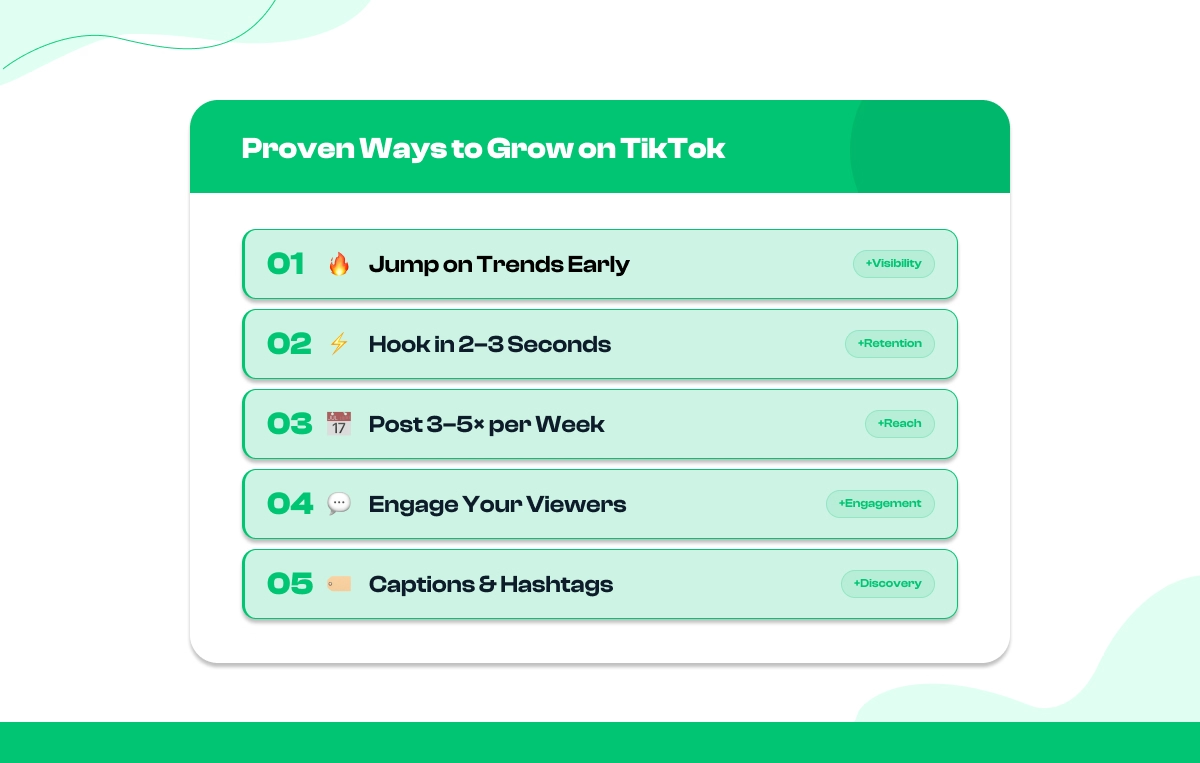
Here are practical, proven ways to grow on TikTok using insights from real performance and engagement trends:
Boosting Your TikTok Growth with SocialPlug
Below is a short, clear overview of how SocialPlug can fit into your TikTok growth strategy.
Why Socialplug? The idea of Socialplug is to help accounts establish early social proof and visibility quickly, especially when starting or trying to break into a competitive niche. It offers social media growth services, including packages for followers, likes, views, and other engagement metrics.
SocialPlug provides a variety of TikTok-focused services, such as:
Conclusion
TikTok’s influence in entertainment, marketing, and e-commerce is unmatched. By leveraging TikTok analytics, creators can enhance content strategy and boost engagement, while brands can optimize ad spend and create targeted campaigns.
Staying on top of trends, adapting to the platform’s algorithm, and maintaining consistency are crucial for success in 2025. TikTok’s ever-growing user base and dynamic features make it a powerful tool for brand growth and audience expansion.
Frequently Asked Questions
How many users does TikTok have in 2026?
As of 2026 estimates, TikTok has around 1.8–1.9 billion monthly active users worldwide, based on aggregated data from Statista and DataReportal projections.
How fast is TikTok growing?
TikTok’s user base has been growing at an estimated 8–10% year-over-year since 2023. Growth has slowed slightly in mature markets but remains strong in Southeast Asia, Latin America, and parts of Africa.
What age group uses TikTok the most?
The largest user group is 18–24-year-olds, followed closely by 25–34-year-olds. Together, these two groups account for over 55–60% of TikTok’s global user base.
Is TikTok good for marketing?
Yes. TikTok delivers higher engagement rates than most major social platforms, strong organic reach, and growing ad tools—making it especially effective for brand awareness, influencer marketing, and social commerce.
What is the average engagement rate on TikTok?
Average engagement rates typically range from 4% to 7%, with smaller (nano and micro) creator accounts often seeing 10%+ engagement, significantly higher than Instagram or Facebook benchmarks.

Joosep, a native of Tallinn, Estonia, serves as the co-founder and chief content strategist at Socialplug. With a track record of establishing thriving e-commerce stores since 2016, he brings a wealth of expertise in search engine optimization (SEO), content marketing, and team leadership. Outside of his professional pursuits, Joosep takes pleasure in creating insightful articles on online marketing and entrepreneurship.
.webp)


0 Comments
Great tips! I never realized how much engagement impacts growth more than just posting frequently. I've been focusing only on content, but now I see how interacting with my audience can make a difference. Time to step up my strategy!
Super helpful article! I always thought Facebook Groups were just for discussions and never really considered them as a tool for growing followers. The idea of actively engaging and sharing valuable content in relevant groups makes so much sense. I'll definitely start participating more and see how it impacts my page. Thanks for the great advice!