
.webp)
.webp)


Twitch Statistics (2026): Audience Data and Advertising Metrics
Twitch Statistics is incomplete without data from TwitchTracker. They continuously track the Twitch data, almost every day. So, how many people use Twitch?
The number itself proves its growth potential for live streaming content creators.
Twitch was launched in 2011 and gathered 3.2 million users within its first year. Amazon did not miss the chance to cash in on this opportunity. They poured $970 millions to bring this platform under their corporate umbrella.
This platform provided a favorable ambience to connect gamers and viewers. The latest growth reports are way more amazing for tech business promotion.
Let’s explore a bit more of it.
Twitch Overview: Key Facts
While it began as a gaming platform, Twitch now allows users to create channels for diverse content, from cooking to fitness.
What Is Twitch?
Twitch is a leading live-streaming platform. It initially focused on gaming, but now covers various categories such as music, art, and lifestyle. Twitch has grown into a major platform with 240 million unique visitors each month and an average of 2.41 million concurrent viewers.
Key features of Twitch include chat interactions, content monetization through subscriptions and ads, and tools like Squad Stream and Clip, which enhance community engagement.
With a 60.3% market share in live streaming, Twitch remains the most popular platform for streamers despite rising competition from sites like YouTube Live and Kick.
Twitch at a Glance (2026 Snapshot)
Twitch User Demography
In the last 6 months, 61.94M people have been visiting the website frequently.

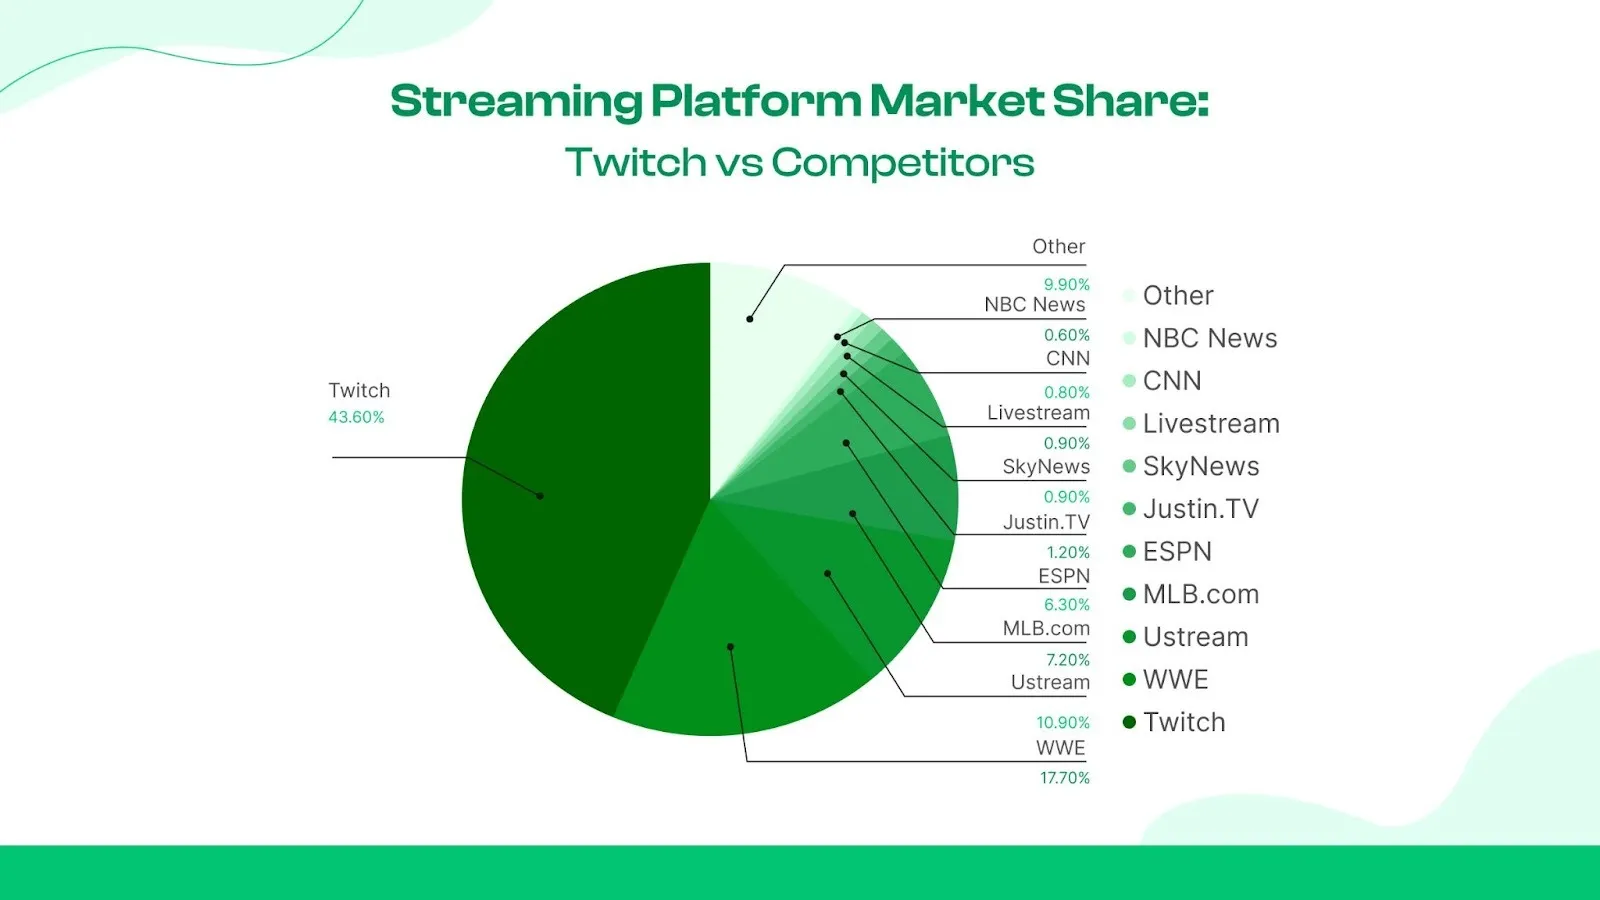
Share of Twitch vs Other Streaming Platforms
Although it holds 70% live watch time, its market share dropped in recent times from its previous peak of dominating influence.
Twitch vs. YouTube Gaming
In the most recent quarter, Twitch recorded 5.1 billion watch hours. On the other hand, YouTube Gaming's streaming reached 2 billion hours, half of Twitch.
Twitch Clips Creation and Views Per Day
Here is the Role of Clips in Channel Growth
Reports show that “Just Chatting” recaps, organized as a set of 25 clips, are the primary growth amplifier of this platform. This category experienced 300% more year-over-year growth with the “IRL” clips. [Source: Tubefilter]
Summary of clip engagement (Jan 2026)
Twitch Clips vs YouTube Shorts and TikTok
YouTube gets more than 70 billion views every day. On the other hand, Twitch gets nearly 50 million views, and TikTok gets around 35 billion views daily. Mobile users provide 35% views for Twitch. Meanwhile, YouTube showed an engagement rate of 5.91%, while TikTok's rate is 3.70%.
Twitch User Statistics and Growth Trends
People have spent a total of 19.0 billion hours on Twitch. [Source: Streamscheme]
The average user spends 95 minutes per day on Twitch. The number is higher than the 20–30 minute average of traditional social media.
The Gen Z viewers are the most emerging streamers, especially in "Just Chatting" (28% of total viewing hours) and "IRL" (In Real Life) categories. For example, nearly 50 million people joined during a month-long Twitch stream for Kai Cenat. Most of the viewers were genZ.
There are a few specific events, for example, during "League of Legends" events, YouTube’s viewer count doubles that of Twitch. Proving it as the most reliable mobile gaming platform.
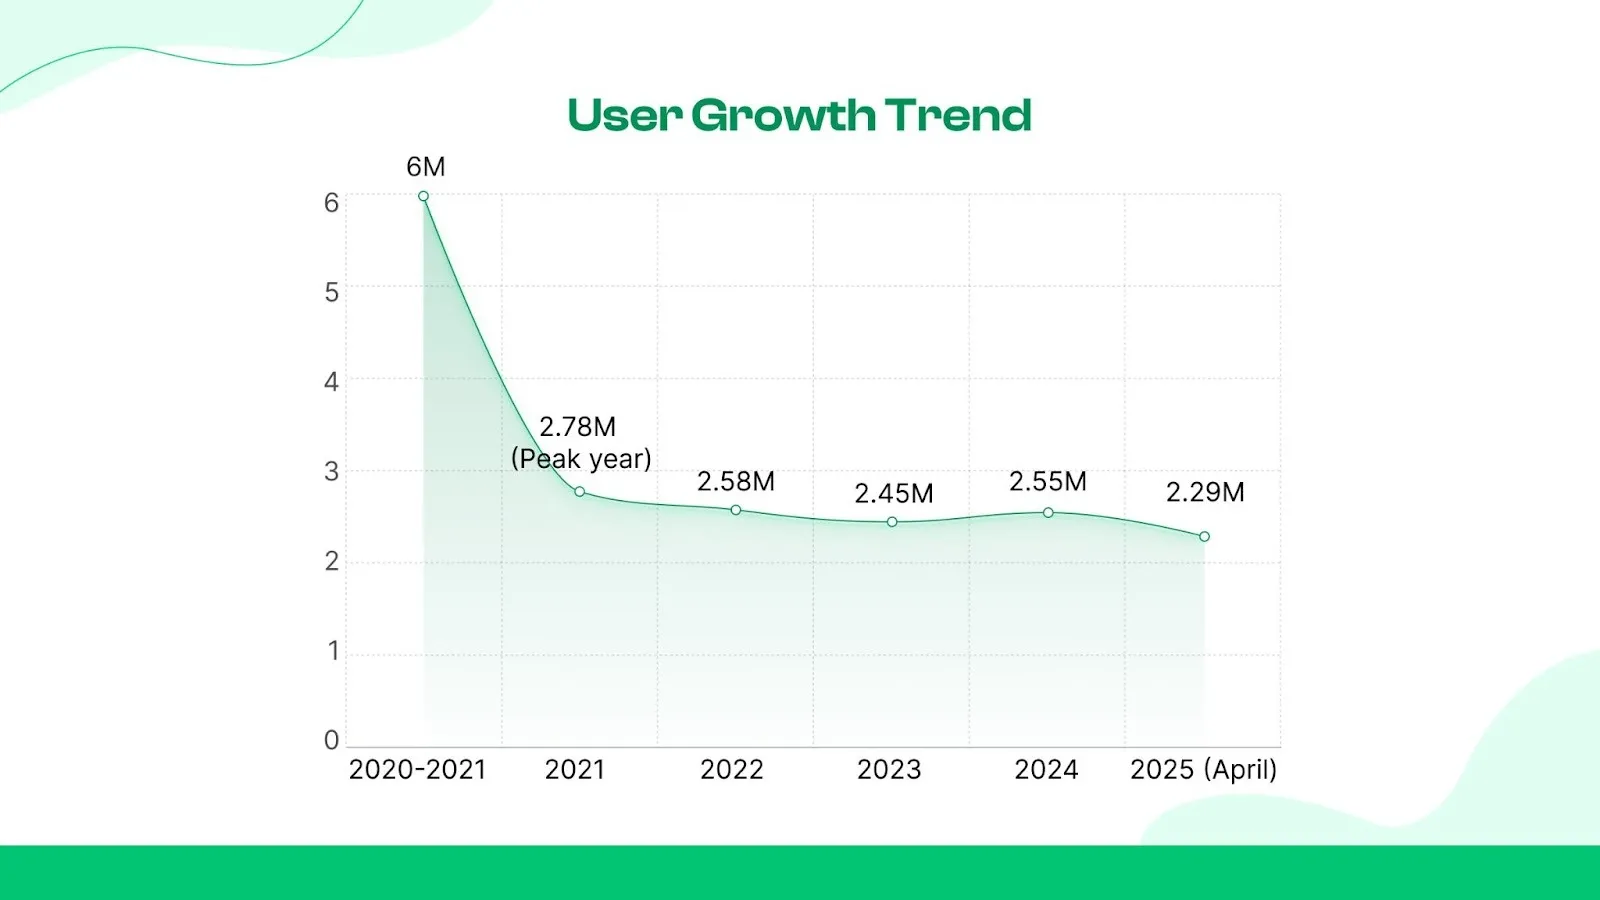
Total Twitch Users Over Time
The platform generated $1.8 billion in revenue during 2024. Market reports show an expected growth rate of over 91% of all streaming content, with 76% of total viewing hours by 2026.
User Growth
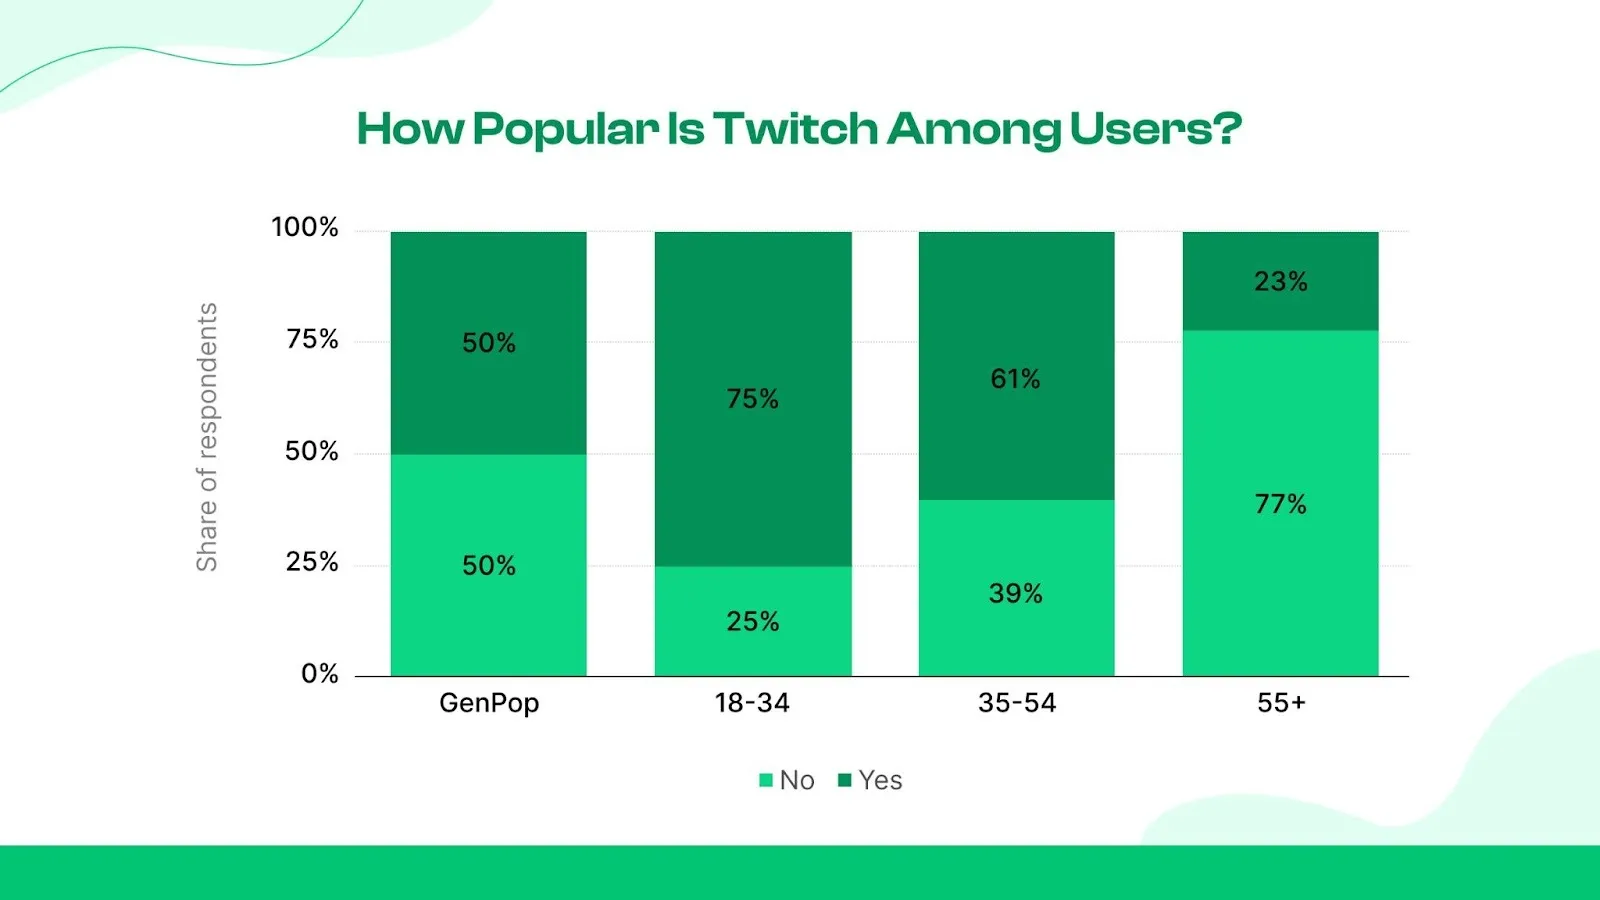
How Many People Know Twitch, actually?
In a 2024 research, we have found that Genpop is quite in the middle ground. Teens and young people (18-34) are more into Twitch, with 75% awareness. [Source: Statista]
Monthly Active Users and Daily Active Users Ratio
Twitch Viewership Growth
Twitch viewership growth. According to the following streaming statistics, Twitch streaming trends are experiencing a new spark. The growth metrics show a decent yet static increase in viewers and streamers since 2022.
Impact of Major Events and Esports
Leading gaming franchises are breaking records of Twitch esports viewership. Especially, displaying significant twitch event spikes in a few events.
Viewership and Watch Time Statistics
Mobile vs Desktop Twitch Viewership
Despite 100 million app downloads, desktop maintains its stronghold on user engagement.
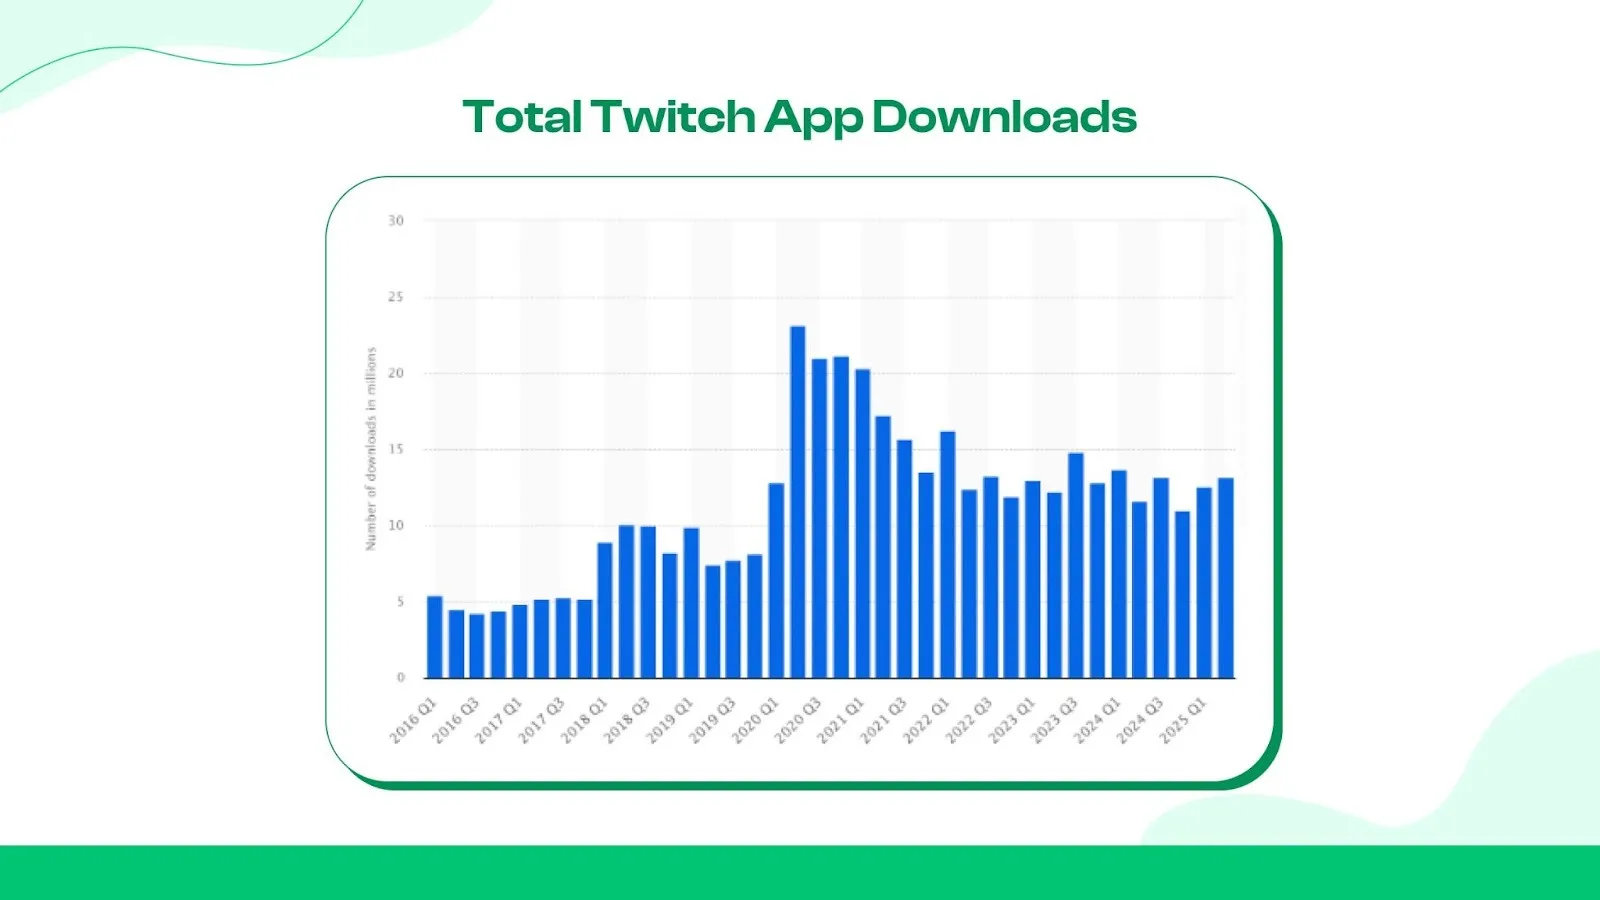
Number of Twitch App Downloads
The Twitch app download peaked in Q2 of 2020 with 23.17 million users. In Q3 of 2016, the download number was 4.26 million. [Source: Statista]
Streamer Drop-Off and Churn Rates
This indicates the ratio of how many creators leave the platform.
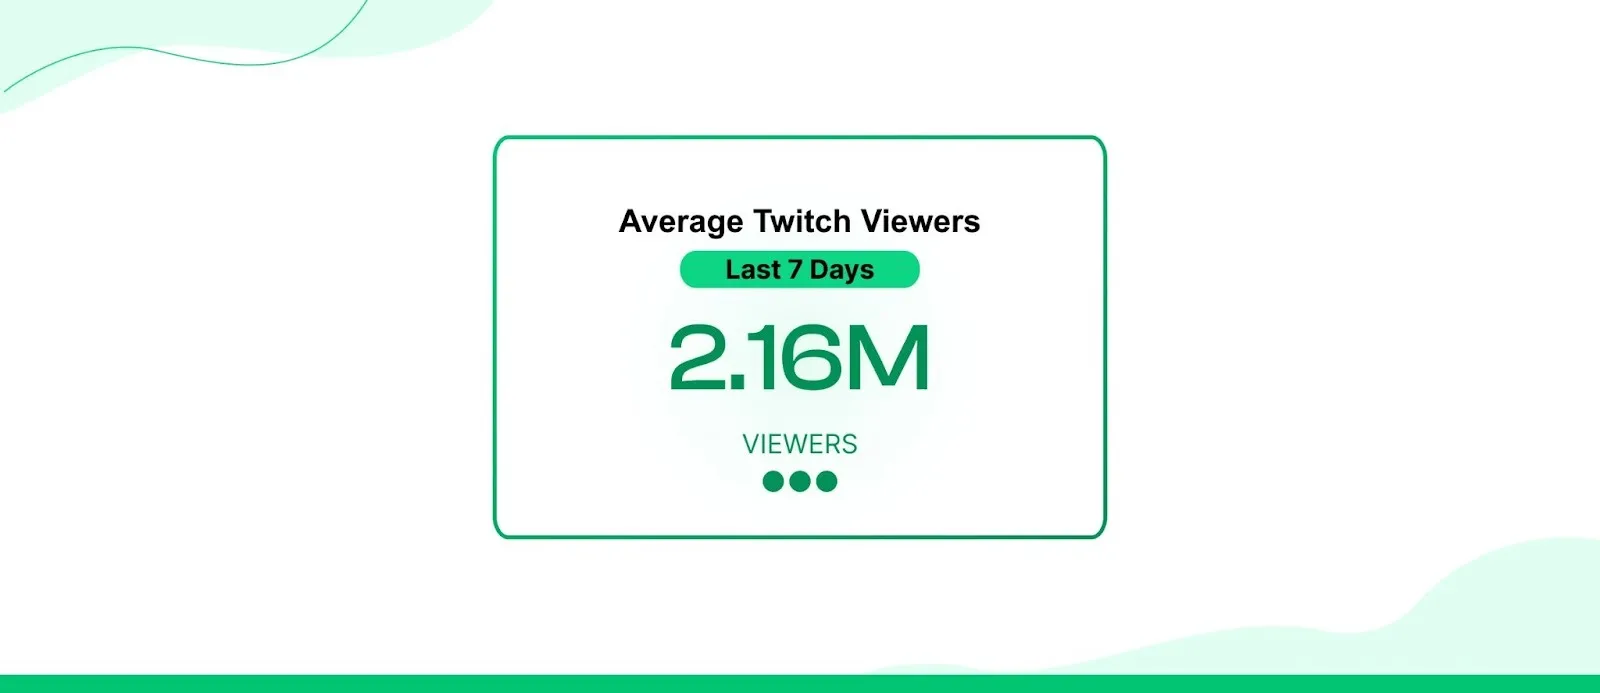
Average Concurrent Viewers
Twitch remains the number 1 platform, with over 2.1 million people watching at any given second.
Total Hours Watched on Twitch
Average Time Spent Per User
Twitch engagement time is experiencing a huge spike. Twitch stream stats prove its worth. The average user now dedicates 95 minutes daily to Twitch, and barely a few social media platforms can rival it.
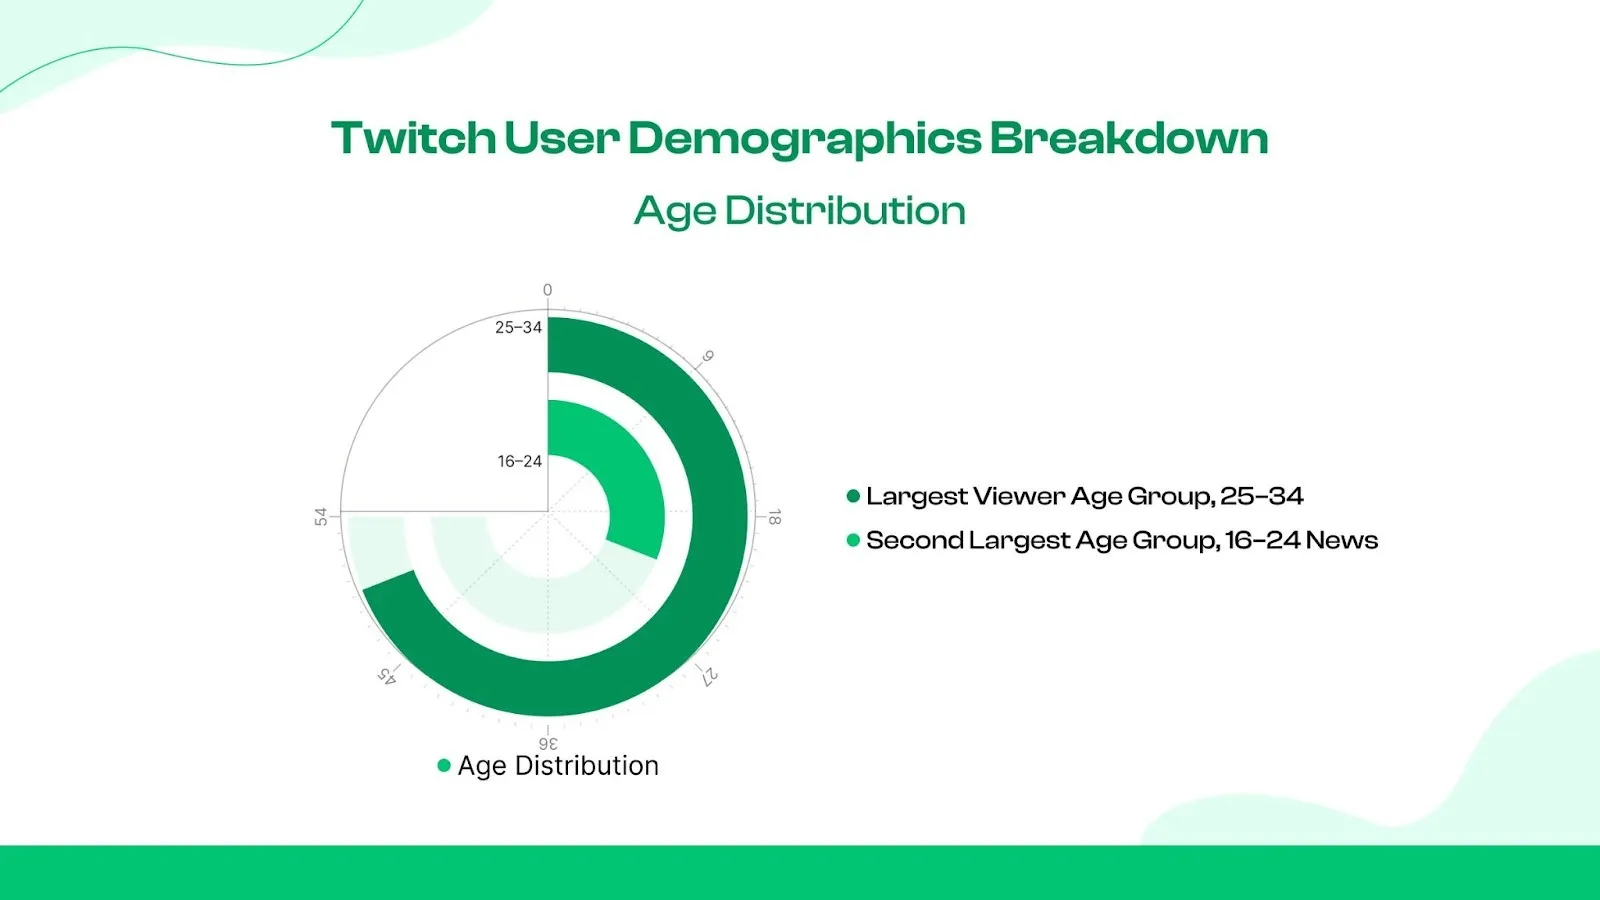
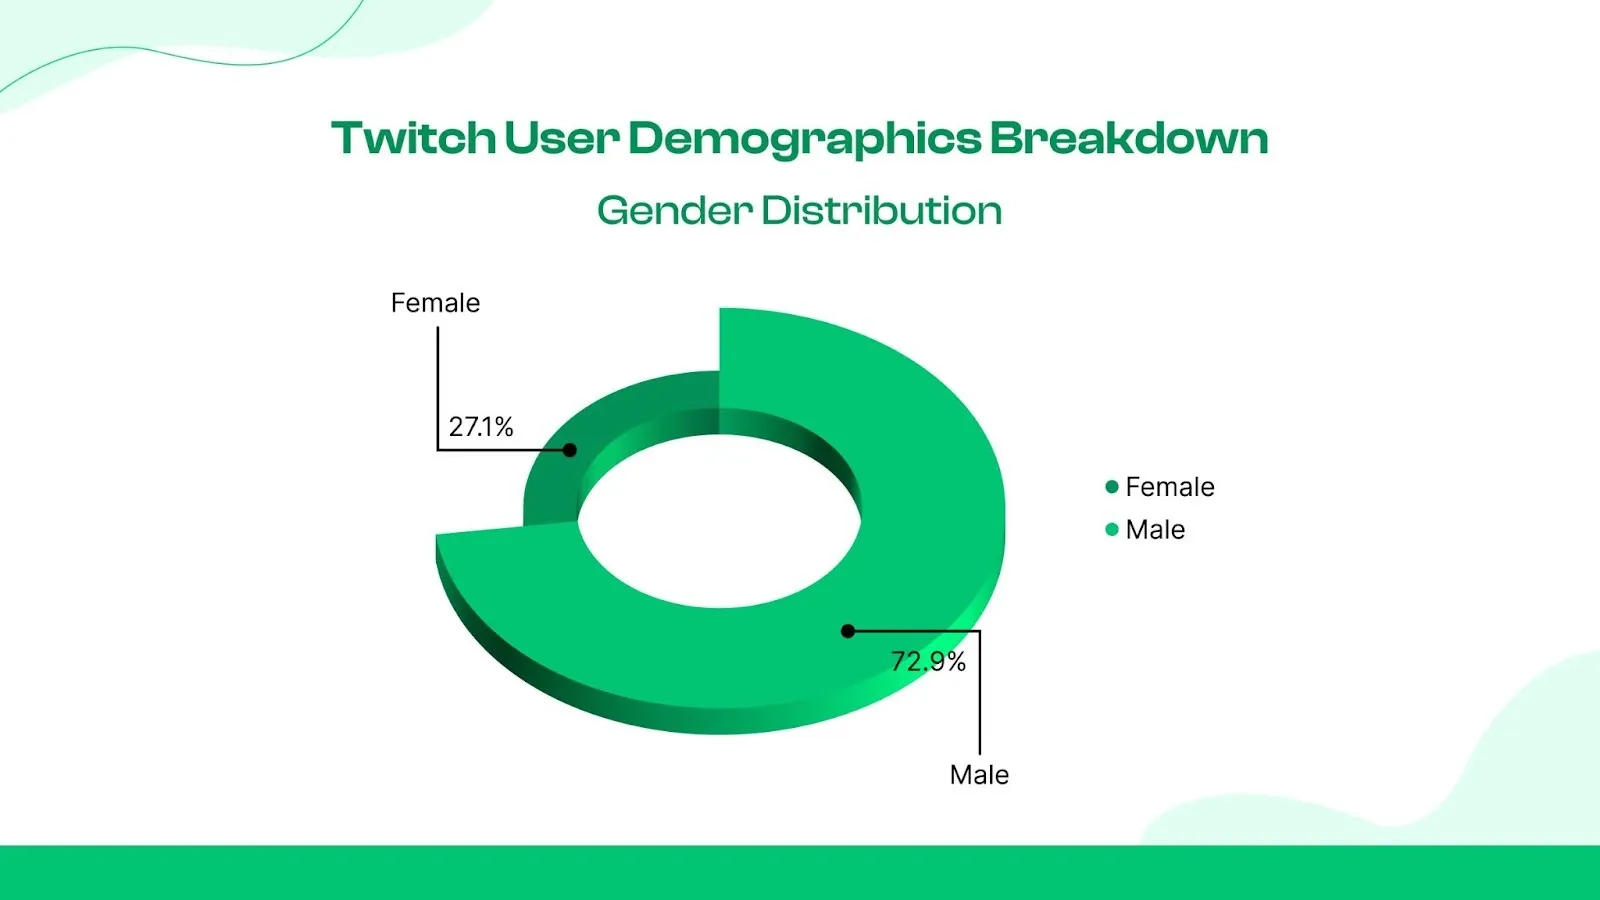
Twitch Demographics and Audience Breakdown
Male viewers display a significant hold on streaming compared to female streamers.
Age category:
Gender:
Geographic Distribution of Twitch Viewers
The USA has the leading viewership on the Twitch platform with 23.6%, while Russia and Germany follow with 9.6% and 8.8%. [Source: DemandSage]
Fastest Growing Regions on Twitch
Twitch growth by region: India and Southeast Asia are showing a growth boost in Twitch streaming. [Source: key group]
Top viewership zones: Brazil has the highest viewership base with a high concentration of local creators. The growth is mostly driven by GTA RP and VALORANT content creators.
Besides, Japan, Germany, France, and Russian streamers and viewers are also making dedicated contributions to this platform.
Twitch Content and Category Statistics
The streaming platform remarkably showed a strategic shift toward conversational content. This segment is now in a leading position in Twitch viewer statistics.
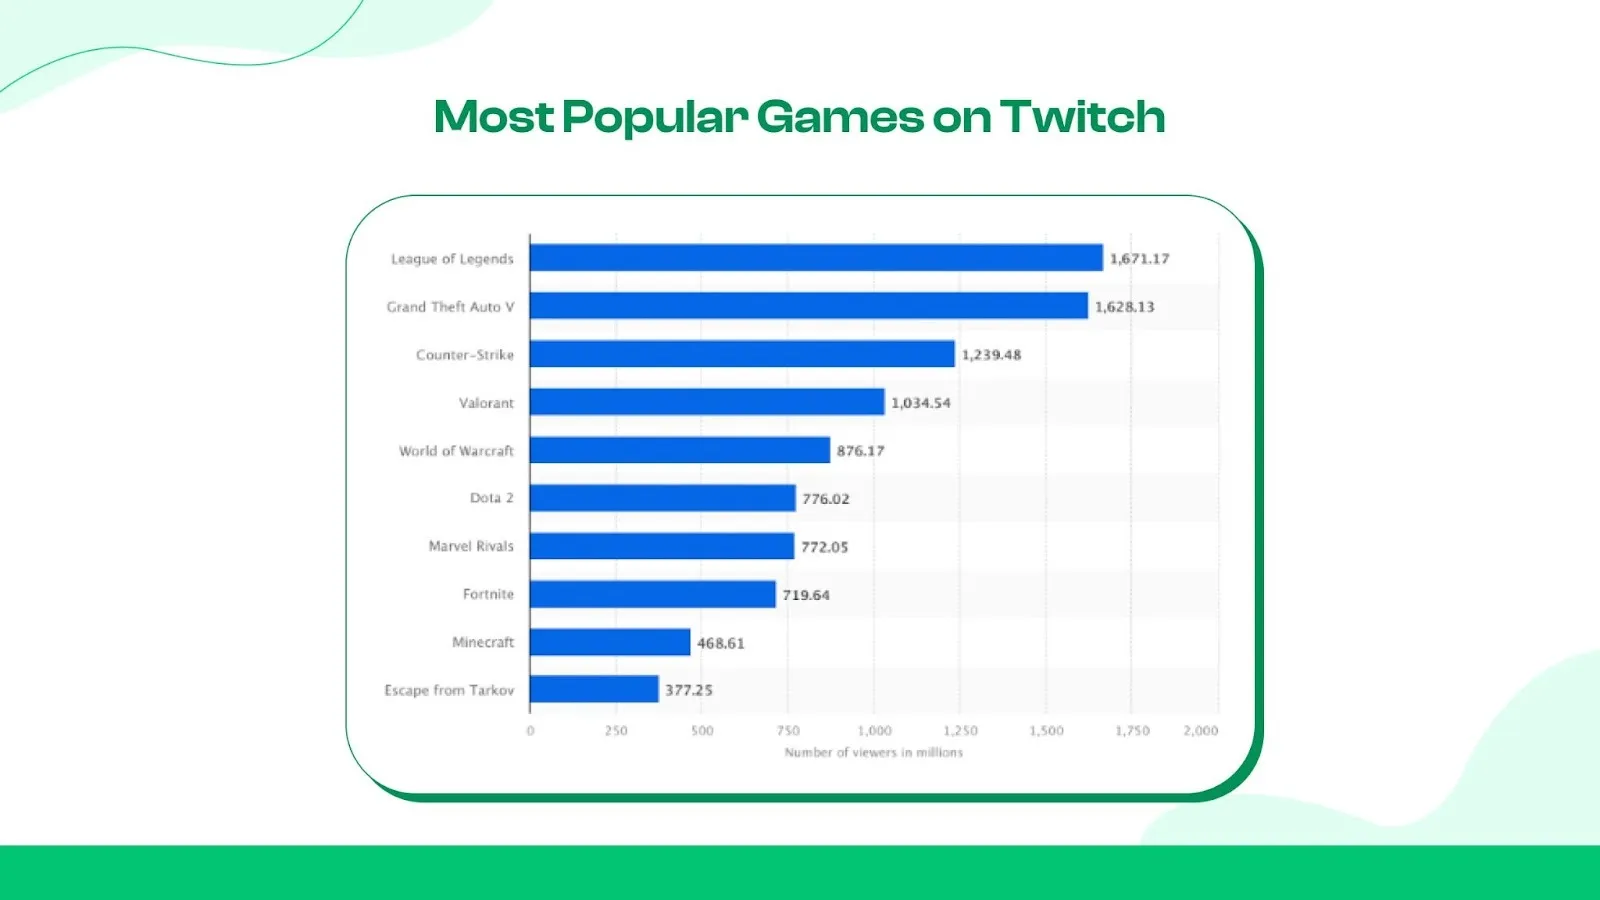
Most Watched Games on Twitch
League of Legends is always the fan favorite for the Twitch streamers, even in 2026. According to Statista, LOL has around 1,671,17M viewers globally
IRL twitch stats suggest subcategories like Travel and Outdoors and Fitness were able to gain 24.1 million watch hours. [Sources: Twitch metrics]
Twitch Streamer Statistics and Creator Economy
After shifting into comfortable, lifestyle-focused content promotion, Twitch streamer stats suggest a better reach extension. This contributed to increasing the visibility of other niche creators and their audience base to connect.
How many streamers are on Twitch?
The number is surely amazing. The platform currently hosts approximately 7.3 million to 9.35 million monthly active streamers. The USA and Europe are major stakeholders supporting this streaming economy.
Twitch Affiliates vs Partners (Comparison)
Twitch partnership split into a two-level monetization process: Affiliates for entry-level monetization and Partners for vetted streamers. As per the Official Twitch Blog, the platform updated its payout policy, announcing the Partner Plus program. Qualifying Affiliates can receive 60/40 or 70/30 net revenue splits.
Year-over-Year Growth
The revenue splits, which previously were reserved for “Partners,” are now also available for “Affiliates” to access higher revenue splits.
Platform Comparison: Revenue Split (2026)
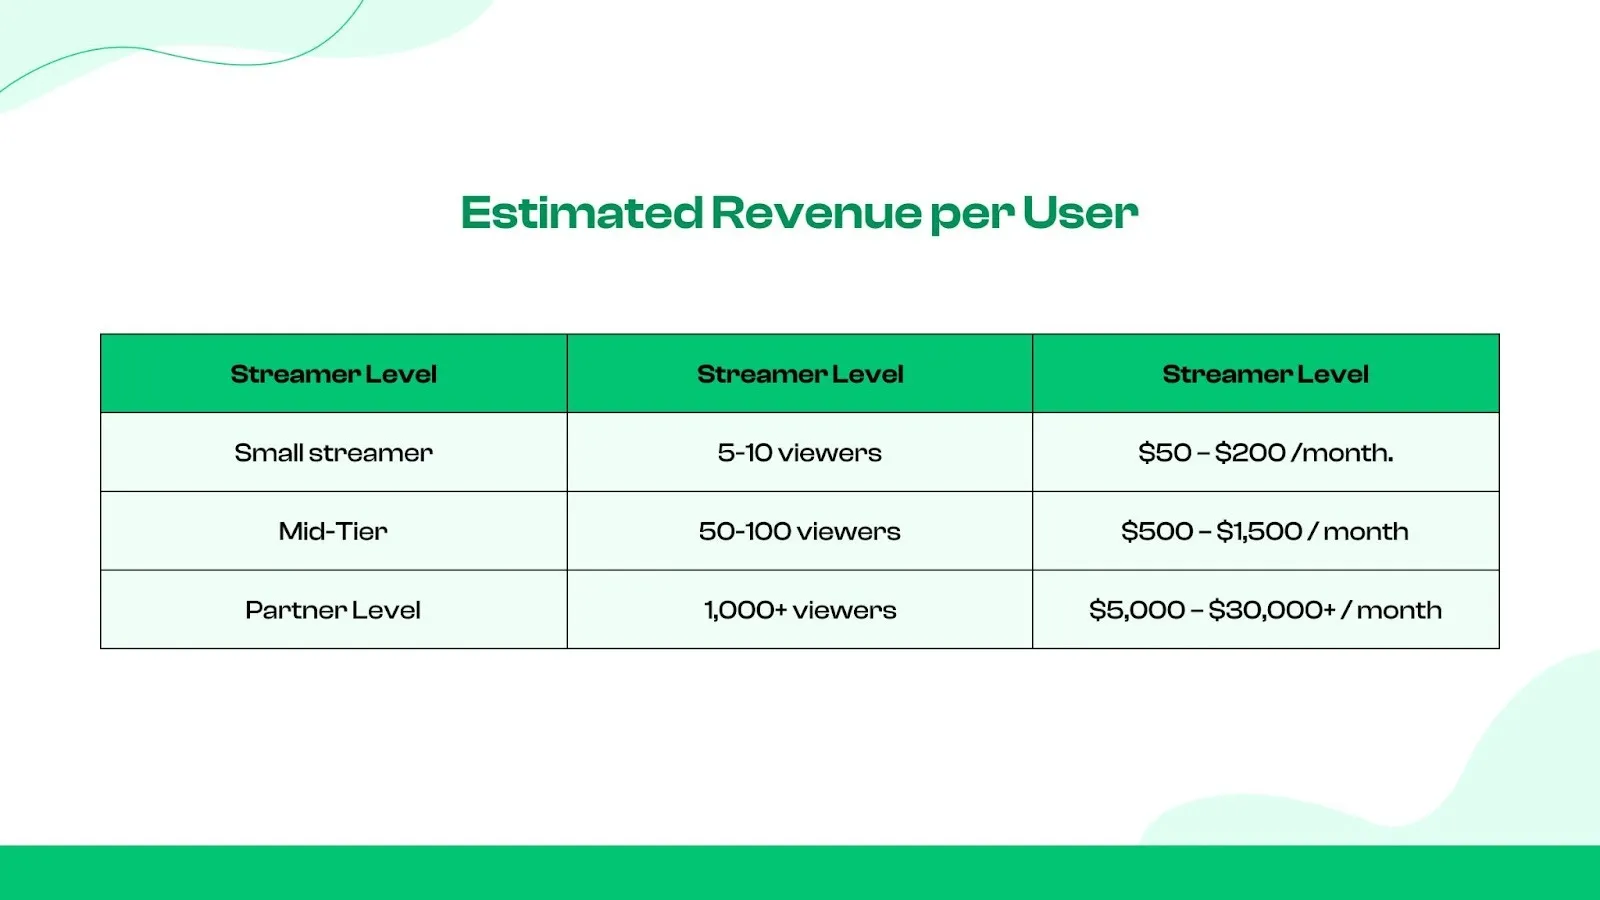
Average Earnings by Streamer Tier
Twitch streamer income does not solely depend on views. It prioritizes Concurrent Viewers (CCV) and audience engagement.
How Much Twitch Streamers Earn?
Twitch Monetization and Revenue Statistics
Twitch's revenue model follows a hybrid, multi-stream method that includes subscriptions, advertising, virtual currency, and Amazon-integrated services.
Twitch Revenue Sources Explained

According to the report of Icon Era, the platform hit r $27.68 million in in-app purchase revenue in 2024.
Viewers Bit purchase to support streamers, and Amazon keeps a percentage of it when the value is added.
Subscriptions, Bits and Ads Revenue
As of 2025–2026, subscriptions remain the platform's core revenue generator.
Brand Sponsorship and Influencer Deals
Twitch brand collaborations have proven success records. For instance, Old Spice gained 31.8K followers on Twitch through its own channel with 24 streamers. The event garnered a total of 16.3K views. This case signals the potential of twitch influencer marketing. [Source: influencer-heros.]
Viewer Engagement and Behavior on Twitch
Recent witch engagement stats showed how much the community is connected.
A study published by the University of Michigan on October 7, 2025, found that 73% of regular Twitch viewers aged 18–29 reported feeling a sense of community belonging, up from 65% in a similar 2023 survey on Twitch chat activity
Chat Interaction and Engagement Rates
Twitch viewer statistics suggest a huge engagement, according to available chat reports and message removal volume.
Follower-to-Viewer Conversion Rates
This is measured by how many of your followers show up when you go live. In 2026, it is now also considered a key indicator of concurrent viewers.
Peak Streaming Hours and Best Times to Go Live
Burnout, Upload Frequency and Longevity
The platform’s core demographic is aged from 20 to 40. This viewer base accounts for 69% US viewers, becoming prone to digital burnout.
Streamers must maintain a higher view spike for three consecutive months to access the 70/30 split revenue share. This putting instencse pressure on creators, demotivating them more. The average peak career duration of a streamer (with 1,000+ ACV) is estimated at 3.5 to 5 years. After this, a strategic shift to a reduction in output is essential to prevent their mental fatigue. [Source: ResearchGate]
Twitch Statistics for Marketers and Brands
Recent Twitch advertising data showed its superior potential for brand engagement. This is the key reason for the recent brand preference for Twitch advertisements.
Streamers and Earnings
The Twitch market cap of the creator world is expanding. In some cases, outperforming platforms like Kick.
Average Earnings (Estimates):
Twitch still controls 60.3% – 67% of all live-streaming hours watched globally.
Twitch Ad Formats and Performance Metrics
Twitch Influencer Marketing ROI
The platform signals a reliable reach, particularly for brands that want to tap into the gaming demographic. Average sponsored Twitch stream influencer streams 1,930 live viewers per sponsored broadcast.
commands a significantly higher rate of $0.55. Surely a notable premium over the $0.34 average seen on Facebook Live. [Source: zebracat.]
Policy Changes, Bans and Demonetization Risks
Why Twitch Still Leads Live Streaming
After integrating with Amazon, the platform experienced better monetization stickiness. Viewers are preferring the environment over Kick or YouTube for gaming streams. Superior "Chat Culture", live stream dominance, and non-gaming niche.
Users send over 29 billion chat messages monthly. This shows 10x higher per capita engagement than YouTube Gaming. In terms of hardcore gaming, live events are the most essential for the platform’s interaction volume.
The LCK Cup 2026 debut on Twitch attracted over 1.1 million peak viewers. A remarkable example of its stronghold on this arsenal.
No gaming category, specifically the “Just Chatting” sessions alone, generated 1.49 billion watch hours in early 2026. This is now more popular than top-tier video games.
How to Grow Faster on Twitch Using SocialPlug
Your followers and viewers are the primary drivers of your growth on Twitch. Socialplug aims to extend your engagement and provide initial support to give a primary push.
Why Streamers Choose SocialPlug.io
SocialPlug.io boosts Twitch growth by connecting streamers with real viewers, increasing engagement, and enhancing visibility. It helps you build a genuine community, attract followers, and stand out in the competitive streaming world.
SocialPlug Services for Twitch Growth
SocialPlug.io helps Twitch streamers grow by increasing live viewers, chatters, and followers and boosting engagement. They offer real, active viewers to make your channel look more credible and help you qualify for affiliate or partner status.
Socialplug’s growth plan allows you to buy Twitch followers and increase Twitch views. This approach provides initial momentum to your channel. Plus, this method encourages organic chat activity to keep your community engaged.
Key benefits include 24/7 support, instant delivery, and a 100% growth guarantee. You can pay with a card or crypto, and you don’t need to sign up. Services start at just $0.008 per viewer.
It’s a simple and affordable way to level up your Twitch channel.
Supporting Long-Term Twitch Growth Safely
SocialPlug helps Twitch streamers to get a boost in organic Twitch growth strategies
by boosting viewers. You will observe static follower growth and improved channel authority while maintaining authenticity.
This service helps improve discoverability and build a strong brand, which is crucial for long-term success. With Twitch demographics evolving, streamers need a strong foundation to grow.
SocialPlug helps increase followers and viewers ethically, allowing streamers to focus on creating quality content.
By boosting viewership early on, streamers can climb the Twitch rankings, attract the right audience, and improve their profit potential.
Whether you’re looking to grow quickly or establish long-term success, SocialPlug provides a powerful, ethical way to enhance your Twitch channel.
Frequently Asked Questions
Which country has the most Twitch viewers?
How much do Twitch streamers earn on average?
What is the most-watched category on Twitch?
How much do 1000 subscribers on Twitch pay?
How many people are using Twitch in 2026?

Joosep, a native of Tallinn, Estonia, serves as the co-founder and chief content strategist at Socialplug. With a track record of establishing thriving e-commerce stores since 2016, he brings a wealth of expertise in search engine optimization (SEO), content marketing, and team leadership. Outside of his professional pursuits, Joosep takes pleasure in creating insightful articles on online marketing and entrepreneurship.
.webp)

0 Comments
Great tips! I never realized how much engagement impacts growth more than just posting frequently. I've been focusing only on content, but now I see how interacting with my audience can make a difference. Time to step up my strategy!
Super helpful article! I always thought Facebook Groups were just for discussions and never really considered them as a tool for growing followers. The idea of actively engaging and sharing valuable content in relevant groups makes so much sense. I'll definitely start participating more and see how it impacts my page. Thanks for the great advice!