
.webp)
.webp)


YouTube Statistics 2026: Key Trends, Data, and Insights
YouTube statistics start with the humble beginnings in 2005 with a single video titled Me at the Zoo. As of 2026, YouTube is more than a video-sharing platform. The platform genuinely influences everything from entertainment trends to marketing strategies.
YouTube is estimated to have over 2.7 billion monthly users worldwide. It also offers creators, brands, and marketers unmatched opportunities to engage with a global audience on any topic.
Understanding YouTube demographics and user statistics is crucial for creators and brands seeking to target the right audience. Today, we will talk about all the essential YouTube stats and trends to help you understand its impact and how you can utilize its full potential.
YouTube Statistics (Our Picks)
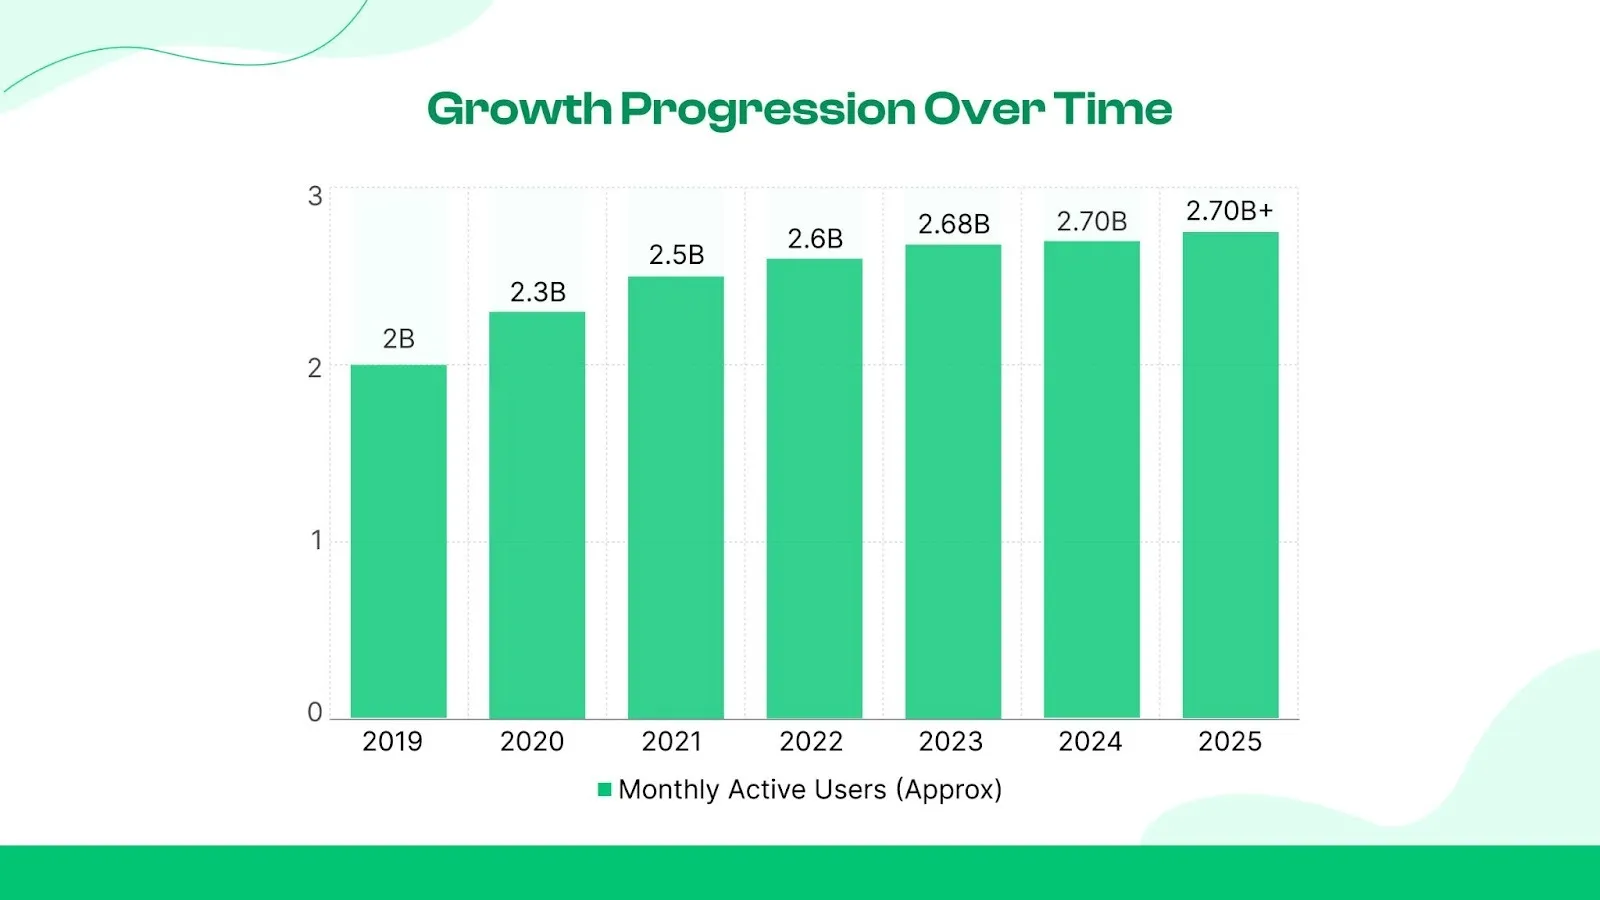
YouTube User Growth
The increasing numbers show how YouTube continues to attract new users globally, becoming a staple of internet culture.
Monthly Active Users (MAU)
YouTube now has over 2.7 billion monthly active users, making it one of the most popular platforms in the world. These are people who log in at least once a month to watch videos, like, comment, or subscribe. Check the numbers below:
The YouTube demographic shows that the majority of users are aged 18–34, which is a prime audience for content creators and advertisers.
Daily Active Users (DAU)
Over 120 million people in the U.S. watch, share, and interact with videos every day consistently. These daily active users are responsible for a massive watch time of over 1 billion hours. (Source: Market.us)
Monitoring daily activity is crucial because it shows how habit-forming YouTube is and helps creators understand when their audience is most engaged. These view stats are essential for planning content and ad campaigns.
Growth Rate Over the Years
Although growth has slowed compared to early years, YouTube continues to add millions of new users each year. These view stats indicate the platform’s ongoing dominance and global appeal.
Mobile vs Desktop User Growth
Logged‑in vs Logged‑out Viewers
Official platform‑wide data for logged‑in vs logged‑out users is not comprehensively published by YouTube. You can get the data from YouTube Analytics.
A large majority of Daily active users and Monthly active users log in with Google accounts to access personalized recommendations and subscriptions. Logged‑out viewers still contribute significantly to overall view counts and watch time.
Most public YouTube user statistics focus on logged‑in users. True viewer counts (including logged‑out audiences) may be even higher than the reported MAU figures suggest.
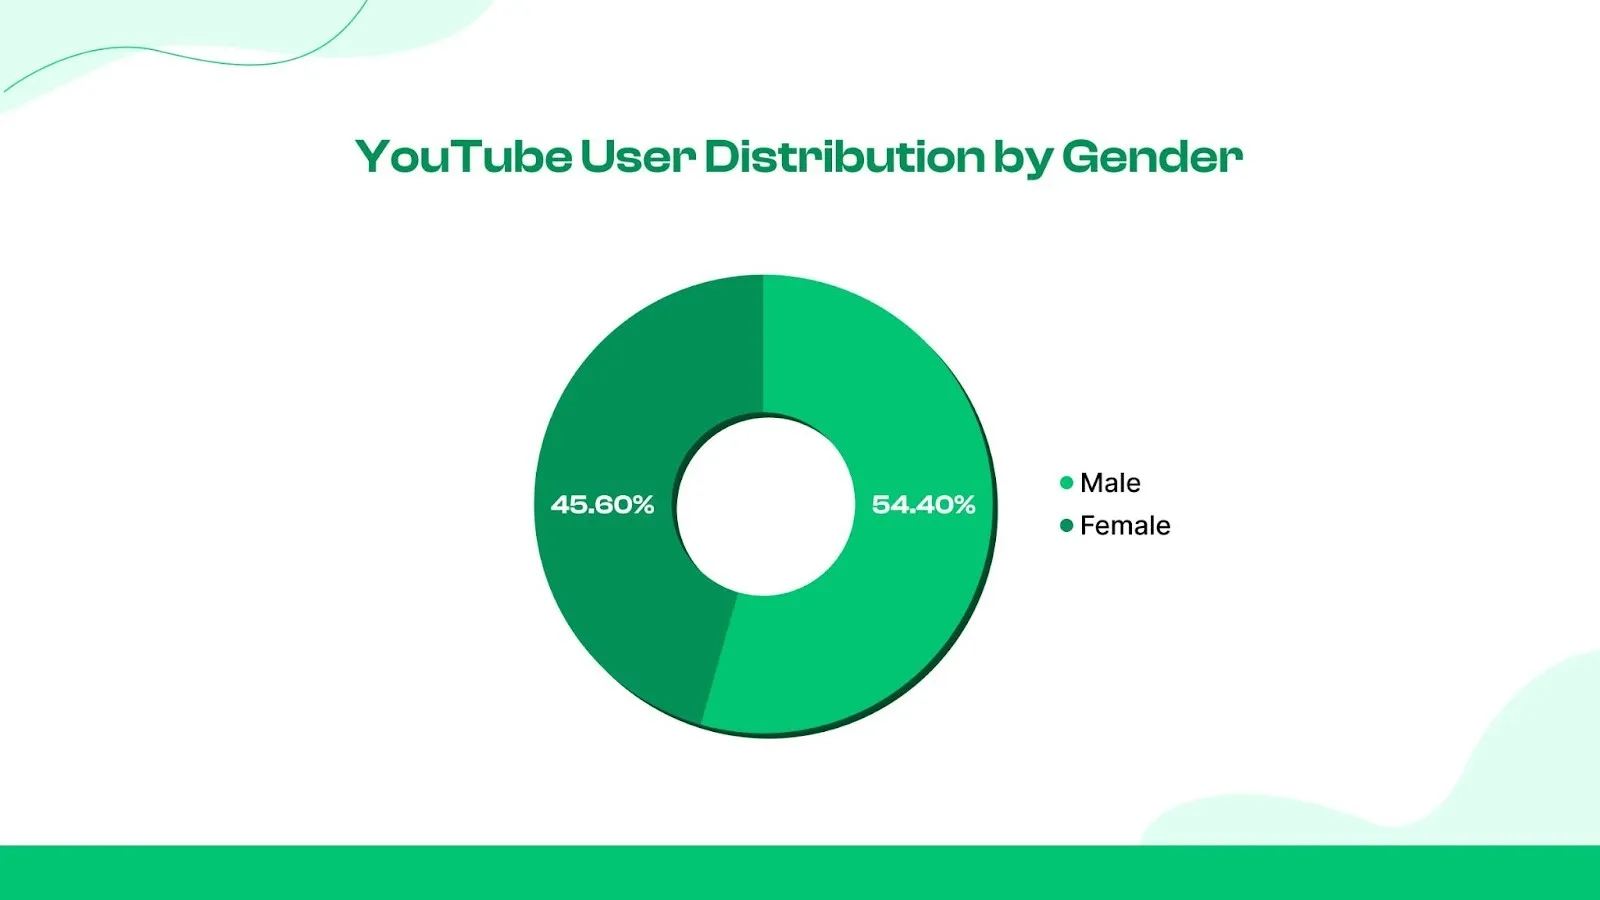
Demographics: Who Uses YouTube?

Let’s understand the demographics now.
YouTube Users By Gender
YouTube Users By Age
Over half of YouTube users fall within the 18–34 age range, making it an ideal platform for brands targeting Millennials and Gen Z.
YouTube Users By Income Level
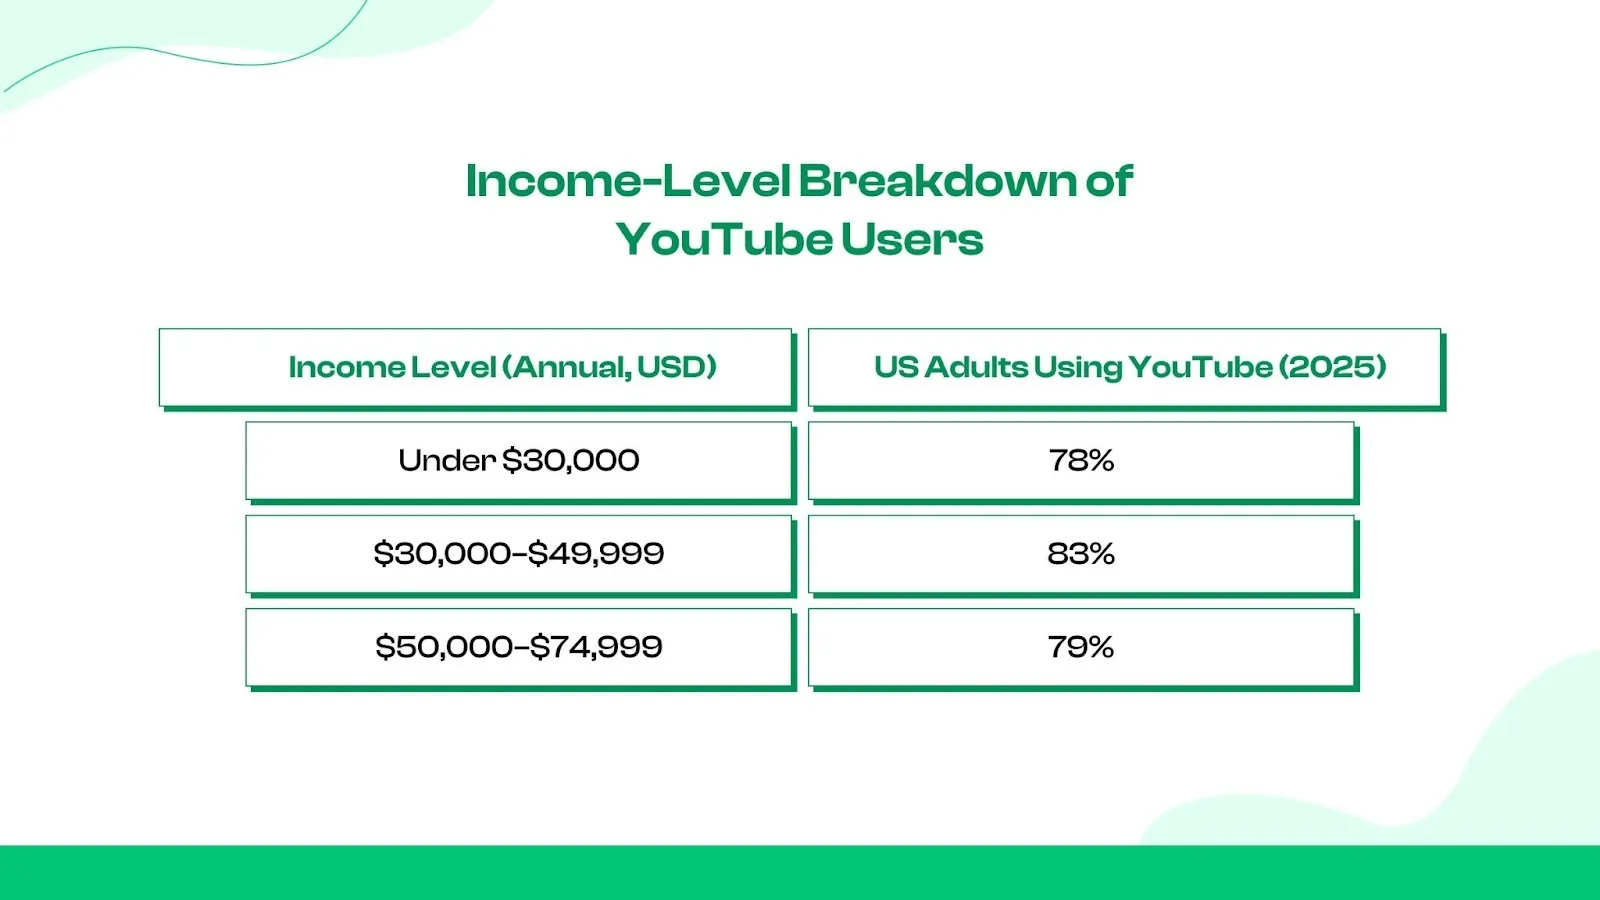
Higher-income users are particularly prominent, likely due to better access to devices and the internet. (Source: Pew Research Center)
YouTube Users By Education Level
Family & Kids Usage Trends
Studies show that about 35% of kids under 12 watch YouTube daily, often co-viewing with parents.
Toddlers and older kids spend an average of 90+ minutes per day on YouTube and YouTube Kids. This makes family content a major driver of view stats and engagement.
Parents often prefer YouTube Kids for age-appropriate videos. Older children may use the main YouTube platform.
Usage Insights: Devices and Behaviors
Ever wonder why some videos go viral while others struggle to gain traction? It’s all about understanding audience psychology.
By using psychological principles, creators and brands can craft content that resonates on a deeper level.

Viewing Habits
The average YouTube session lasts 40 minutes. (Source: touchstorm)
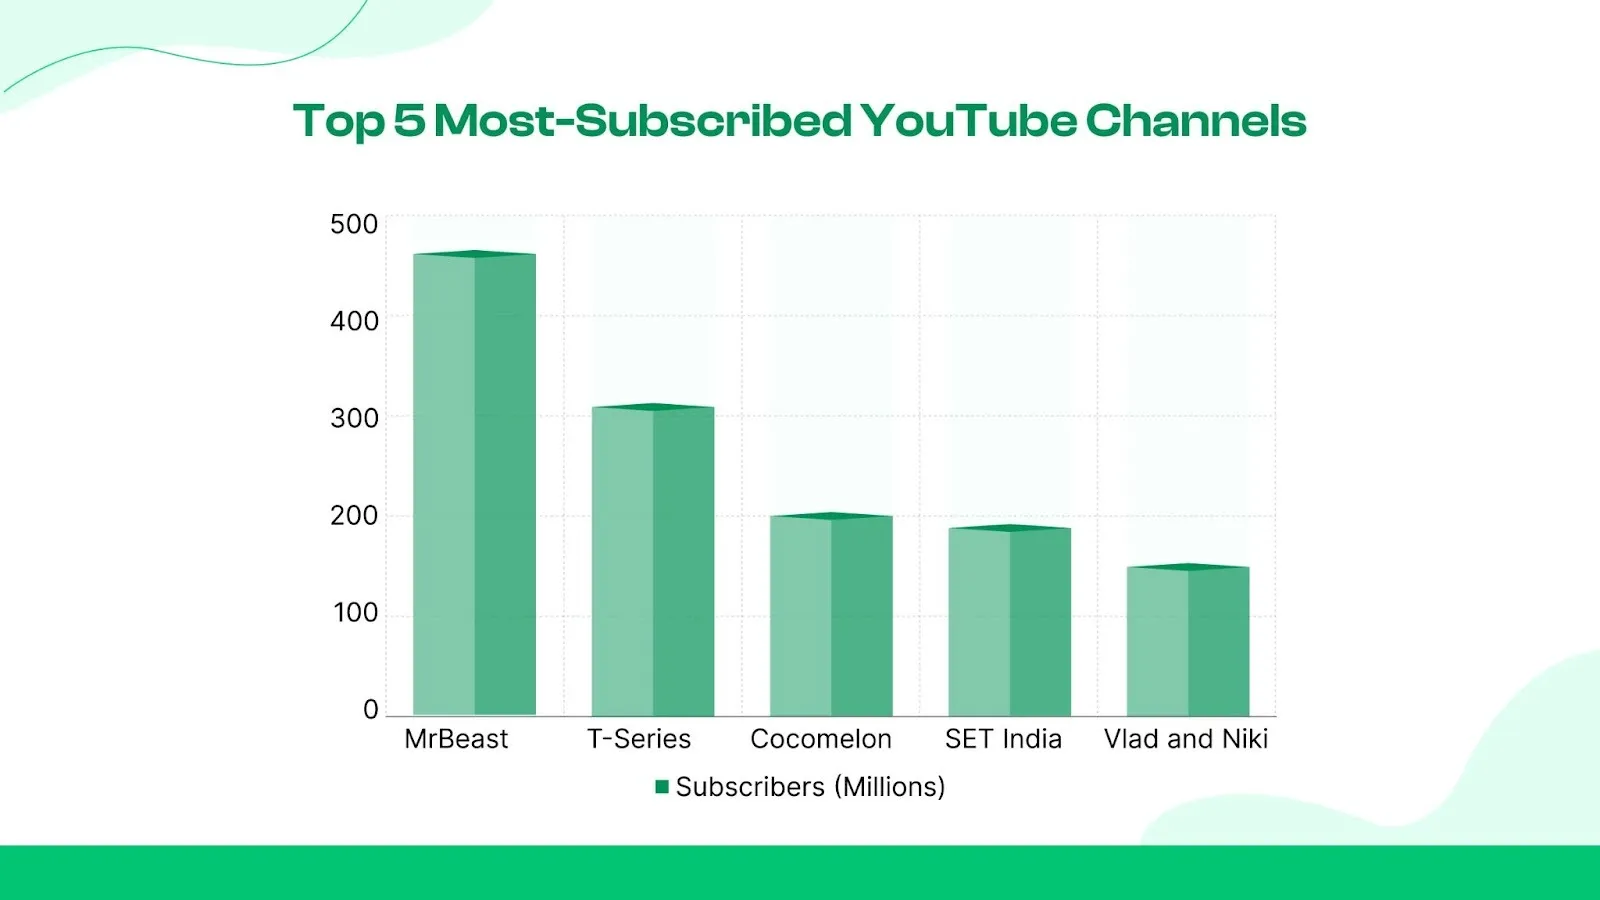
YouTube’s Top 5 Most Subscribed Channels
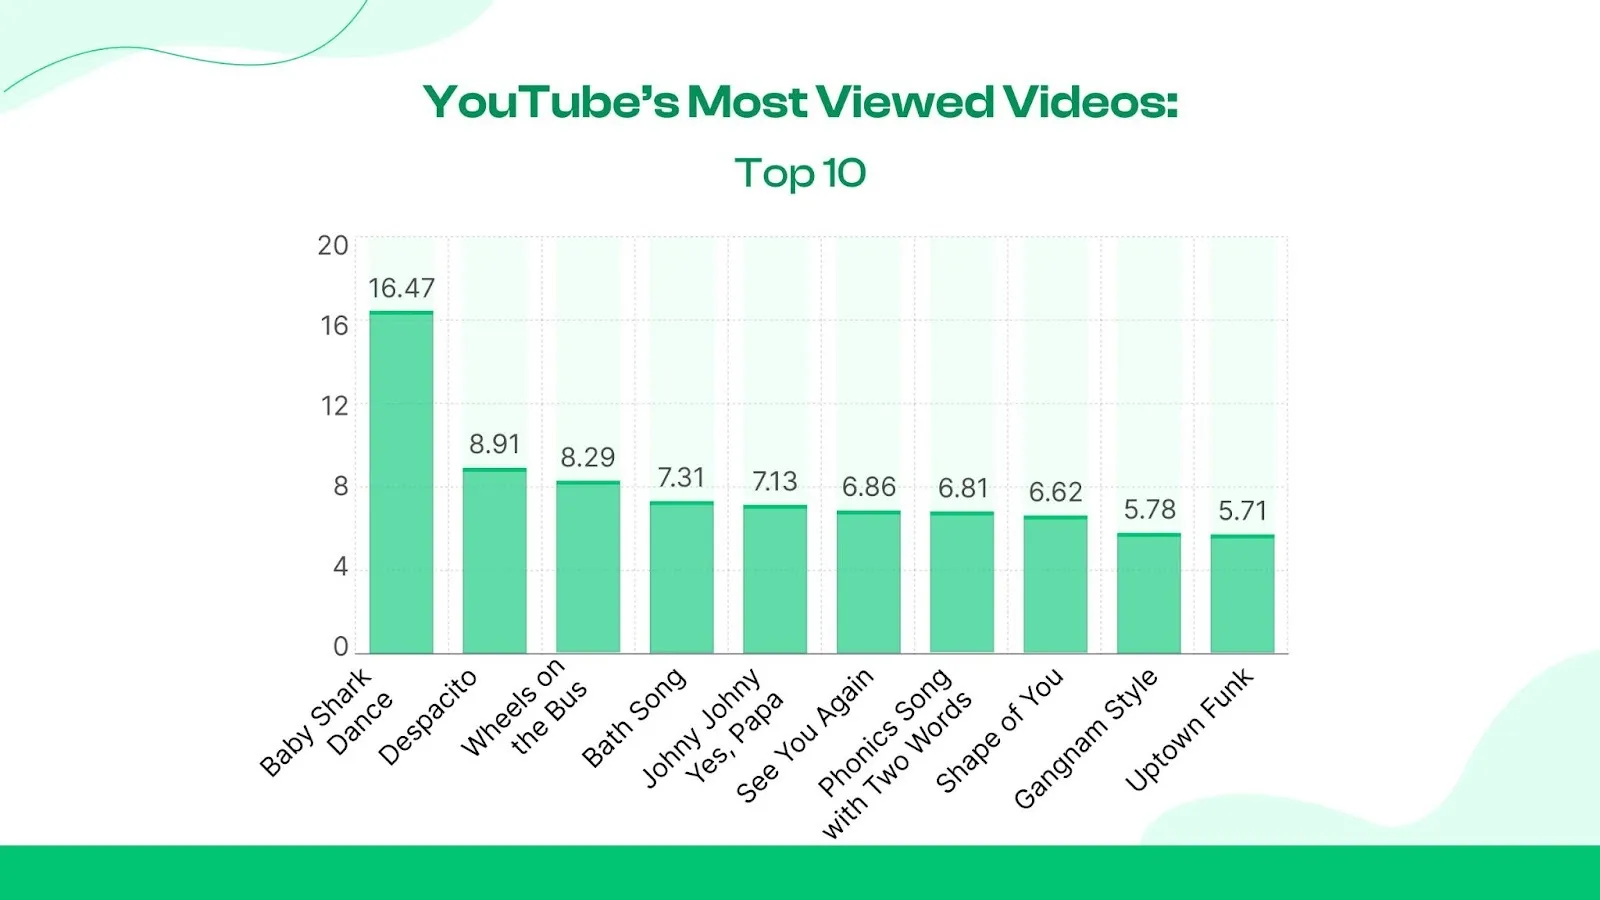
Top 10 Most-Viewed Videos on YouTube
Average Time Spent on YouTube
On average, people spend 49 minutes per day watching YouTube. This includes short clips, long videos, tutorials, and music, contributing heavily to total YouTube monthly watch time.
Sessions per Day
Most users open YouTube 1–2 times per day, though some check multiple times, especially during breaks, evenings, or weekends. Each session adds to the overall view stats and helps maintain high numbers of Daily active users.
Second-Screen Viewing Behavior
Many users now watch YouTube while using another device, such as scrolling social media, texting, or browsing the web. This second-screen behavior boosts view stats because videos keep running even when users multitask.
Younger audiences are especially prone to second-screening, which makes it a key part of the YouTube demographic and overall YouTube user statistics.
Background Play & Multitasking
Another growing trend is background play, where users let videos, music, podcasts, or tutorials play while doing other things.
Even if users aren’t actively watching, these views count in view stats and contribute to Daily active users and total YouTube monthly watch time.
YouTube Content Consumption Patterns
Short‑form content like YouTube Shorts gets massive daily views and quick engagement, especially for mobile users.
Long‑Form vs Short‑Form Consumption
This means both formats are important: short‑form content for reach and buzz, and long‑form content for keeping viewers watching.
Live Streams vs Pre‑Recorded Videos
Live streams significantly outperform pre-recorded videos in "stickiness."
Livestream viewers tend to contribute significantly to total view stats and YouTube monthly watch time because sessions often last many minutes or even hours.
Educational vs Entertainment Content
The difference between Educational and Entertainment content on YouTube has blurred into a hybrid often called "Edutainment”.
People come to YouTube for both learning and entertainment. Entertainment genres like music, comedy, and lifestyle remain among the most viewed, together accounting for a large share of total views.
Educational videos, DIY tutorials, and how‑to guides are strongly growing, with year‑over‑year increases in view stats showing that audiences increasingly use YouTube for learning as well as leisure.
Because educational content often keeps viewers watching longer, it contributes valuable Watch Time & Audience Retention metrics that help boost discovery through the algorithm.
Music, Gaming, Vlogs & Podcasts
Certain niche formats show predictable consumption patterns:
YouTube Engagement Statistics
These basic stats help creators understand how many people watched and how interested they were in the content.
Likes, Comments & Shares
Interactions like likes, comments, and shares are core indicators of engagement on YouTube. On average, many channels see like‑to‑view ratios around 1.8%, with comment rates lower but still meaningful for community building.
Average Engagement Rate Benchmarks
Across platforms and niches, a “healthy” engagement rate combining likes, comments, and shares relative to views is often around 3–5% for most content.
Watch Time & Audience Retention
Watch time and retention remain two of the most important metrics on YouTube. Videos that keep viewers watching, whether YouTube monthly watch time across many sessions or consistent attention per video, are more likely to be recommended by YouTube’s algorithm.
Click‑Through Rate (CTR) Averages
Click‑Through Rate (CTR) measures how often people click on a video after seeing its thumbnail and title. Industry averages sit around 4–6%, with some niches like gaming or entertainment seeing higher CTRs, and educational or long‑form content slightly lower.
YouTube by the Money
YouTube has become one of the world’s biggest money-making platforms.
YouTube Annual Revenue
In 2024, the platform’s total revenue, including ads and subscriptions, was approximately $54.2 billion. It went up more than 14 % from the year before. Advertising remains the largest single source of income.
Advertising Revenue Breakdown
Most of YouTube’s money comes from ads.
In 2024 alone, YouTube’s advertising revenue reached over $36 billion, growing steadily each year. Advertising revenue includes banner ads, video ads, display ads, and sponsored placements.
CPM, RPM & Monetization Benchmarks
To understand how creators earn money:
Typically, creators see CPMs vary widely based on niche and geography, often anywhere from $2 to $20+ per 1,000 views, but RPM is usually lower because it includes all views (even those without ads).
Creator Earnings (Small vs Large Channels)
Between 2021 and 2023, creators collectively earned more than $70 billion from their content, showing how YouTube supports huge earning potential at scale.
Creator income usually comes from:
Memberships, Super Chats & Super Thanks
Beyond ads, YouTube offers features that let fans support creators directly:
Subscription Products (YouTube Premium, Music, TV)
YouTube also makes money from subscription services:
Ad Revenue
Creator Earnings
Subscriptions
Sustainability on YouTube: Going Green
Sustainability is increasingly influencing content trends, and YouTube is no exception.
The Power of Playlists & Community
Well‑structured playlists guide viewers through related videos
Playlist Usage & Watch Time Impact
YouTube data shows that adding videos to playlists can increase watch time by up to 15%, helping creators improve their YouTube monthly watch time and keep viewers watching more content without interruption.
Community Posts & Engagement Lift
YouTube’s Community tab lets creators post text, images, polls, and links beside their videos. YouTube doesn’t publicly release all stats for community engagement. Creators often report higher comments and likes on weeks when they use community posts regularly because these posts nudge subscribers back to watch new videos and engage more often.
Creator Economy & Sustainability
Creators in the YouTube Partner Program (YPP) can make a sustainable income, but revenue varies widely depending on content niche, audience size, and engagement.
Full‑Time vs Part‑Time Creators
YouTube’s creator ecosystem is huge, with over 115 million active channels as of 2026. Only a small percentage are full‑time creators, but many part‑time creators contribute significantly to overall YouTube user statistics as well.
Burnout, Upload Frequency & Longevity
Maintaining a steady upload schedule can help growth, but it can also lead to burnout for many creators. A consistent and balanced upload strategy rather than chasing daily uploads tends to produce better long‑term view stats and creator well‑being.
Channels that burn out often see stagnation in Daily active users, while those that pace themselves tend to retain loyal watching communities longer.
Copyright, Demonetization & Policy Risks
Navigating YouTube’s rules is one of the biggest ongoing challenges for creators. Copyright strikes and policy violations can lead to demonetization or even channel termination if unresolved.
Awareness of guidelines, especially around unauthorized content, is essential for long‑term survival on the platform.
Creators who understand copyright rules and respond to policy changes tend to maintain more stable YouTube user statistics and continued access to monetization.
YouTube Usage by Country
India leads globally with 462 million users, translating to a 38% adult reach rate (Source: DataReportal).
Top Countries by Users
Fastest-Growing Regions
While established markets like the U.S. remain large, many emerging regions are experiencing rapid growth in YouTube audiences.
Places like India, Pakistan, Egypt, Nigeria, and the Philippines have seen double-digit increases in users over recent years.
For example, Bangladesh saw around 18 % growth in 2025, and Egypt grew about 15 %, highlighting the strong momentum in these markets.
Not just Western audiences, but also viewers in South Asia, Southeast Asia, Africa, and Latin America are driving a significant part of global usage and view stats.
Language-Based Consumption
Language plays a huge role in how people watch YouTube. In many countries, most videos are consumed in the local language rather than in English. For example:
This means creators can reach broader audiences by tailoring titles, descriptions, and subtitles to local languages, not just English. Localization often leads to better retention and engagement in YouTube user statistics.
Trends to Watch in 2026

YouTube Shorts Are The Catch
YouTube Shorts are a massive part of YouTube’s footprint today. Shorts now accounts for roughly 10% of all time spent on YouTube.
Shorts Daily & Monthly Views
Shorts attract over 70 billion views every day and reach more than 2 billion monthly active users, making them one of the biggest engines of engagement on the platform.
Shorts vs TikTok vs Reels
In 2026, YouTube Shorts often outpaces competitors in sheer reach:
Most Popular Content Categories: YT Shorts
YouTube Advertising Statistics & Performance Benchmarks
YouTube advertising costs vary by format, but common benchmarks include:
These figures help advertisers plan campaigns and estimate spending based on expected results.
Different industries and audiences can push these numbers up or down, but these values represent broad averages seen across campaigns.
Skippable vs Non-Skippable Ad Performance
Overcoming Challenges as a Creator
Building a successful YouTube channel isn’t without its hurdles. Here are some common challenges and how creators overcome them:
Tools to Complement YouTube Analytics
How Socialplug Can Help You Stand Out
Socialplug helps creators boost visibility, credibility, and early momentum. This can be especially helpful for new channels looking to build trust and attract attention faster while growing Daily active users.

While YouTube’s built-in analytics provide a solid foundation, using external tools can help your channel reach a wider audience. Whether it’s enhancing engagement, boosting visibility, or refining your content strategy, these tools can be game-changers:
Social Engagement Services: Socialplug
If you’re looking to gain traction on YouTube ethically and effectively, SocialPlug is a platform you shouldn’t overlook. It’s designed for creators who want to:
With SocialPlug, you’re not just investing in numbers; you’re investing in building a sustainable and impactful presence on YouTube.
The Future of YouTube: What Lies Ahead

As technology and consumer habits evolve, so does YouTube.
YouTube’s future is bright, and creators who adapt to emerging trends will be well-positioned for success.
Conclusion
YouTube is more than just a platform for video sharing; it’s a medium for creators looking to build, grow, and monetize their content. Whether you’re just starting or aiming for the next milestone, leveraging data-driven strategies is key.
By combining YouTube’s analytics with external tools like Social Plug, you can turn insights into action and action into growth. Visit Socialplug today and start building your YouTube success story!

Joosep, a native of Tallinn, Estonia, serves as the co-founder and chief content strategist at Socialplug. With a track record of establishing thriving e-commerce stores since 2016, he brings a wealth of expertise in search engine optimization (SEO), content marketing, and team leadership. Outside of his professional pursuits, Joosep takes pleasure in creating insightful articles on online marketing and entrepreneurship.


0 Comments
Great tips! I never realized how much engagement impacts growth more than just posting frequently. I've been focusing only on content, but now I see how interacting with my audience can make a difference. Time to step up my strategy!
Super helpful article! I always thought Facebook Groups were just for discussions and never really considered them as a tool for growing followers. The idea of actively engaging and sharing valuable content in relevant groups makes so much sense. I'll definitely start participating more and see how it impacts my page. Thanks for the great advice!