You look at a social media report full of numbers. None of these numbers prove your hard work pays off. Why does this happen?
Social media KPIs help you close this gap. A key performance indicator represents a specific number tied directly to a business goal. It is not just any random stat from your platform.
Most dashboards show dozens of metrics at once. They show likes, impressions, follower counts, and video views. Only a tiny fraction of these stats matter for your goals. Measuring performance means choosing a few correct numbers instead of collecting every available metric.
Your chosen metrics depend on your specific objective. Brand awareness requires certain numbers. Engagement demands different numbers. Lead generation and sales need completely different targets. Choosing the wrong stats leaves you with lots of activity but no actual progress.
Let's learn more about these metrics and the best way to select them.
Good KPIs Start With a Real Audience
Explore the SocialPlug services built to grow the audience behind every number you track.
A social media KPI is a number with a purpose. It measures progress toward a business goal.
A KPI is different from a metric. A metric is any number on a platform dashboard. Dashboards show impressions. They show post likes. They list follower counts. They track video views. Platforms display hundreds of default metrics.
A KPI attaches a goal to a metric. You select it for a real business reason. It helps you find more leads. It helps you increase total sales. It helps people recognize your brand. A number without a goal is just noise on a screen.
Think about engagement rate as an example. Alone, it is just a simple metric. Your goal might be building an active group. You track engagement rate against a target goal. That metric becomes a KPI. The number stays identical. Its role changes based on your goal.
Two brands can choose different KPIs. Both choices can be right. A store wants more sales. That store tracks conversion rates. It tracks cost per click. A media brand wants more reach. That media brand tracks impressions. It tracks audience growth. Neither brand tracks the wrong thing. They track numbers suited to their goals.
Want your follower count to mean something? Buy real YouTube subscribers and give your growth numbers a genuine base.
The Core Difference Between Social Media Metrics and KPIs
A metric is any number a platform tracks automatically. A KPI is a metric tied to a specific business goal. A KPI has a targeted outcome attached to it.
The Golden Rule: Every KPI is a metric, but not every metric is a KPI.
One Number with Two Roles
The exact same piece of data can do two different jobs. It can act as a background metric. It can act as a core KPI depending on your team.
▶Metric Example: You glance at raw comment counts to compare two posts. You have no specific target attached to the numbers.
▶KPI Example: Your goal is building a community. You set a target to grow comments per post by 20% this quarter. That turns comments into an active KPI.
Reach as a Metric Versus a KPI
Platform dashboards display reach by default. Its strategic importance changes based on your campaign objective.
▶When Reach is a KPI: Your goal is brand awareness in a new market. You track reach against a precise target. You want to reach 50,000 unique users.
▶When Reach is a Metric: Your goal is direct sales. Reach stays a background indicator. Conversion rates and click through rates become your actual KPIs.
How to Tell the Difference
Ask yourself a simple question before you build a report. Does this number prove you hit a specific goal? Is it just sitting there as background information?
▶Avoid Wall Reports: Crowding your dashboard with every available platform number proves nothing. It creates unhelpful noise.
▶Focus on Impact: Track a few specific KPIs tied directly to real goals. This makes your reporting easy to read. It makes your reporting easy to act upon.
Four Pillars of Social Media KPIs
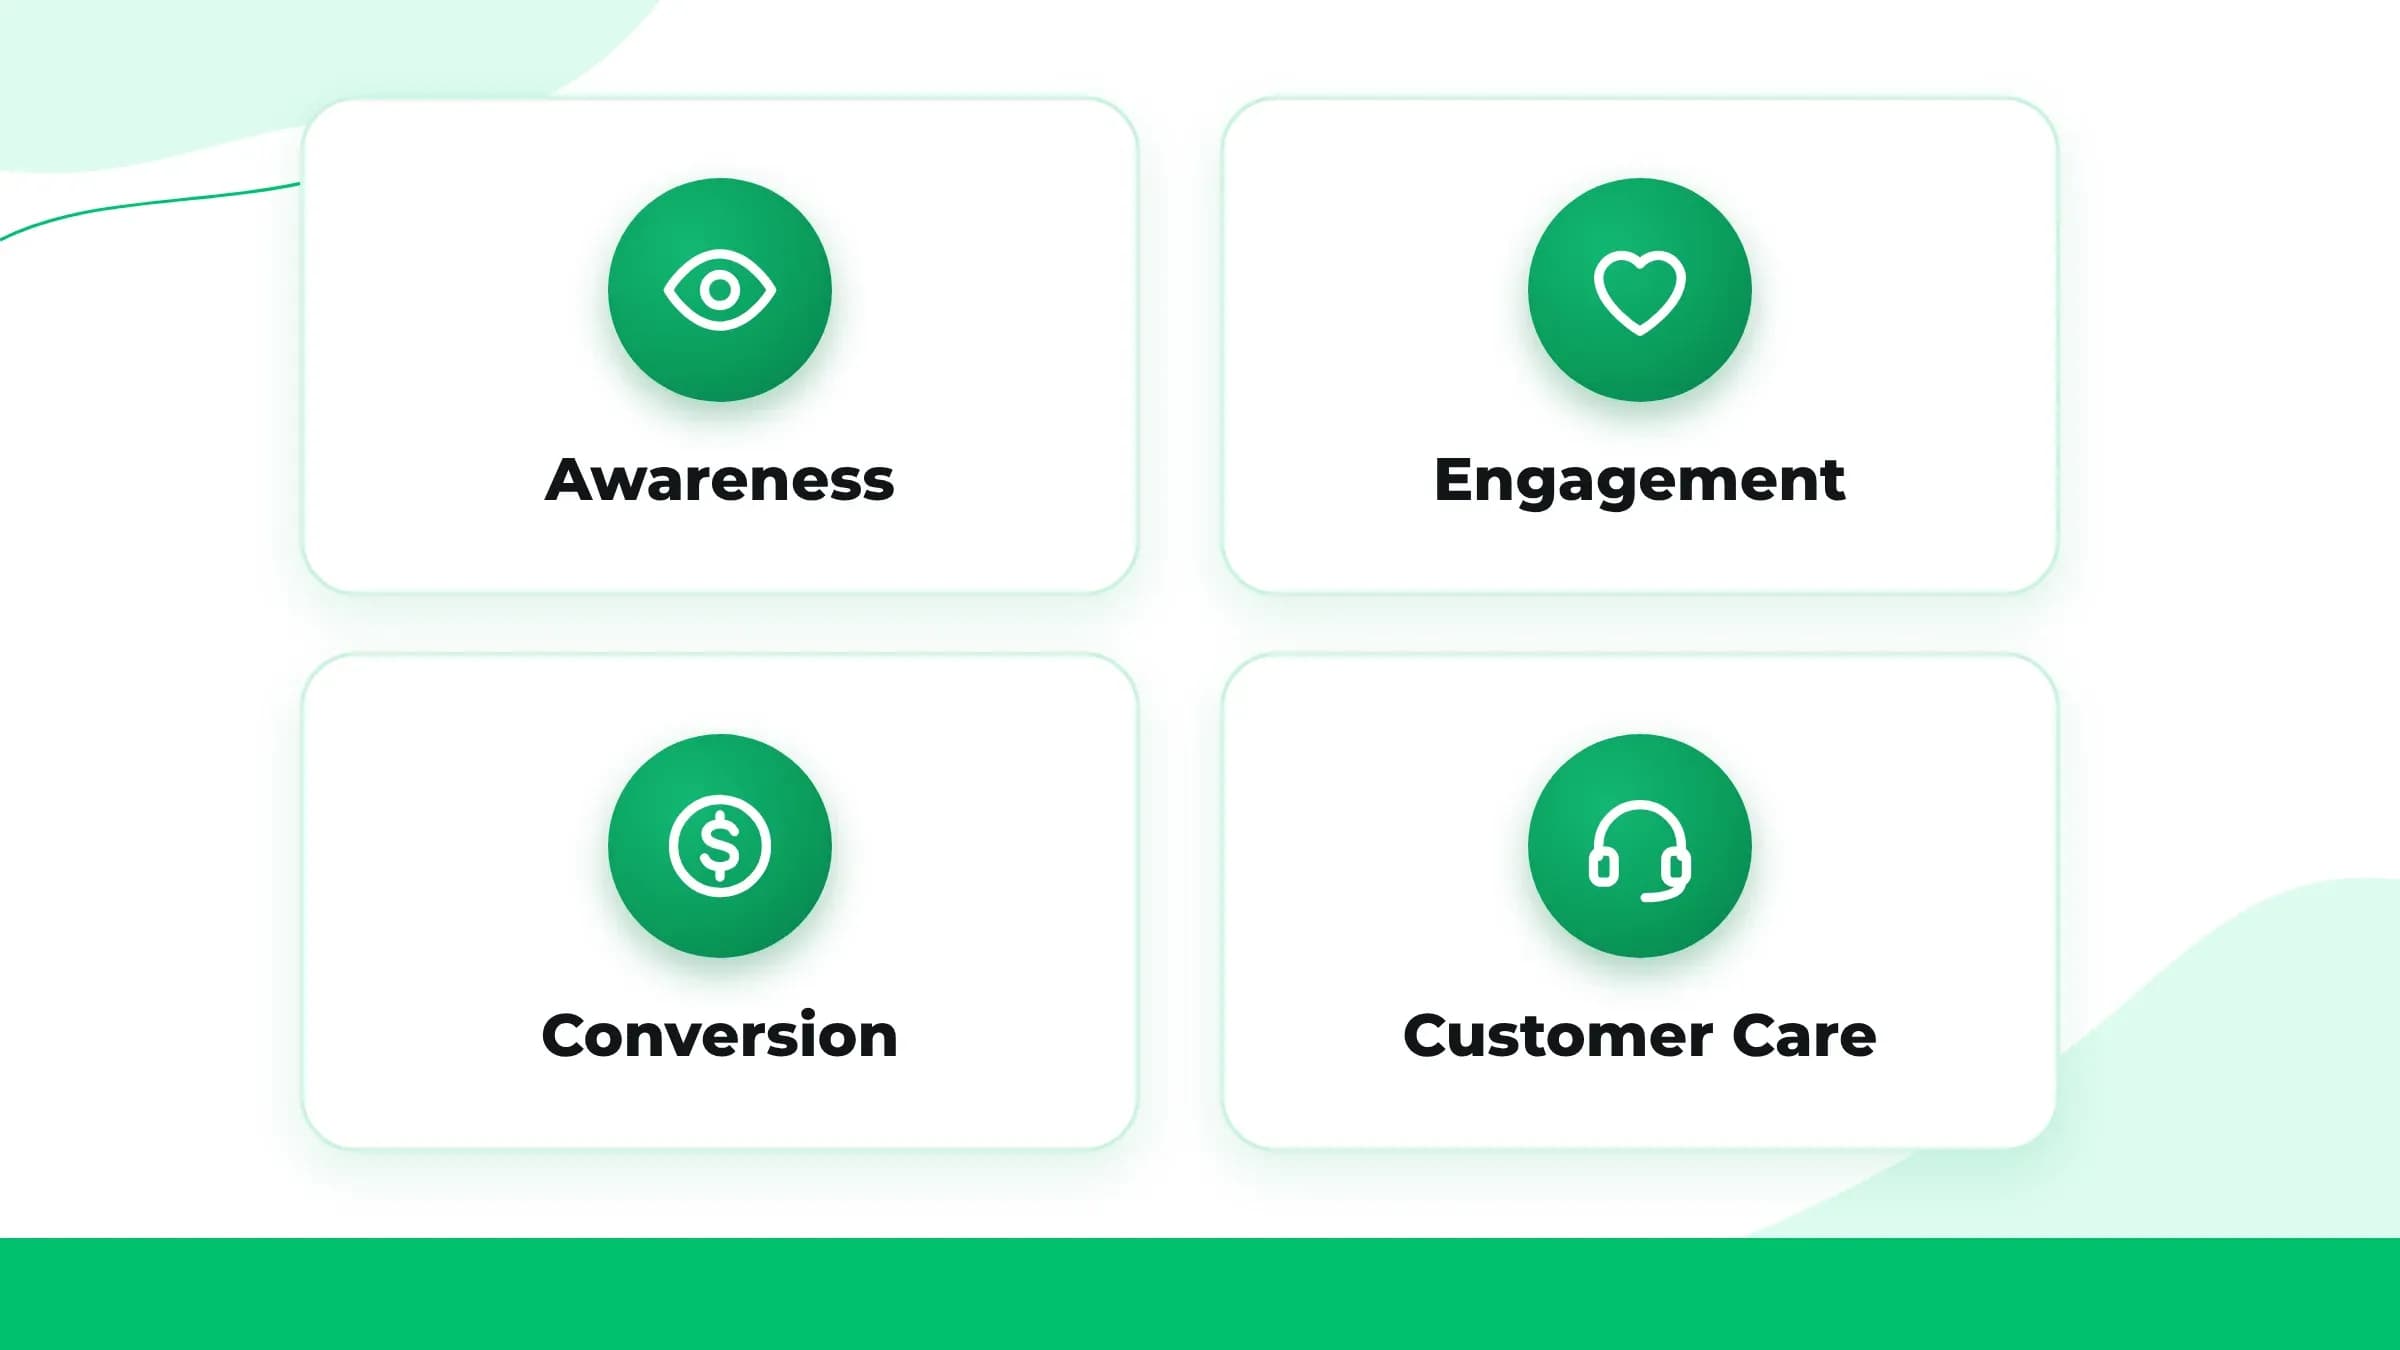
Every social media KPI fits into one of four main categories. Each category answers a distinct business question. Every category matters at a specific stage of your strategy.
Category
Question Answered
Awareness KPIs
Are people discovering your brand?
Engagement KPIs
Is your content connecting with your audience?
Conversion and Revenue KPIs
Is social media driving sales or leads?
Customer Care KPIs
Are you supporting customers well on social channels?
Awareness KPIs
Awareness metrics record audience discovery. They are vital at the start of marketing pushes. They help during product releases. They help when entering fresh markets.
▶Core Metrics: Reach counts individual viewers. Impressions track total views including repeat views. Audience growth rate measures new followers over time. Brand mention volume tracks online discussions.
▶Strategic Limit: High reach numbers do not guarantee real interest. Teams must pair awareness metrics with engagement data.
Engagement KPIs
Engagement metrics track active interactions. They look past simple feed scrolling. They drive community building. They reveal which topics capture attention.
▶Core Metrics: Likes, comments, shares, and saves track user interest. Saves indicate content utility. Shares show message trust. Comment sentiment measures overall tone.
▶Strategic Insight: High reach paired with low engagement reveals strong content distribution. It shows weak audience connection.
Conversion and Revenue KPIs
Conversion metrics tie social actions directly to financial outcomes. Financial outcomes include product sales, newsletter signups, and call bookings. These numbers satisfy executive reporting requirements.
▶Core Metrics: Click through rate measures link traffic percentage. Cost per click calculates spend per visitor. Customer acquisition cost tracks total expense to win a client.
▶Management Impact: Executive teams rely heavily on these revenue statistics to evaluate budget performance.
Customer Care KPIs
Customer care metrics evaluate support performance across direct messages. They evaluate support across public comments. They matter for brands using social channels as help desks.
▶Core Metrics: First response time measures initial reply speed. Resolution rate tracks fully solved customer issues. Customer satisfaction score collects post support feedback ratings.
▶Trust Impact: Fast and helpful replies directly build long term customer trust.
Give your awareness numbers a real head start. Buy Twitter followers and put an active audience behind every post.
How to Measure Brand Awareness on Social Media
Awareness metrics measure total audience visibility. They prove whether your content gets in front of people.
Strategic timing matters most during early campaign stages. It helps during new account launches. It works well when expanding into fresh markets. People in fresh markets lack familiarity with your company.
They track sheer visibility. They do not track user interest. They do not track direct sales. User interest and sales belong to later campaign stages.
Reach
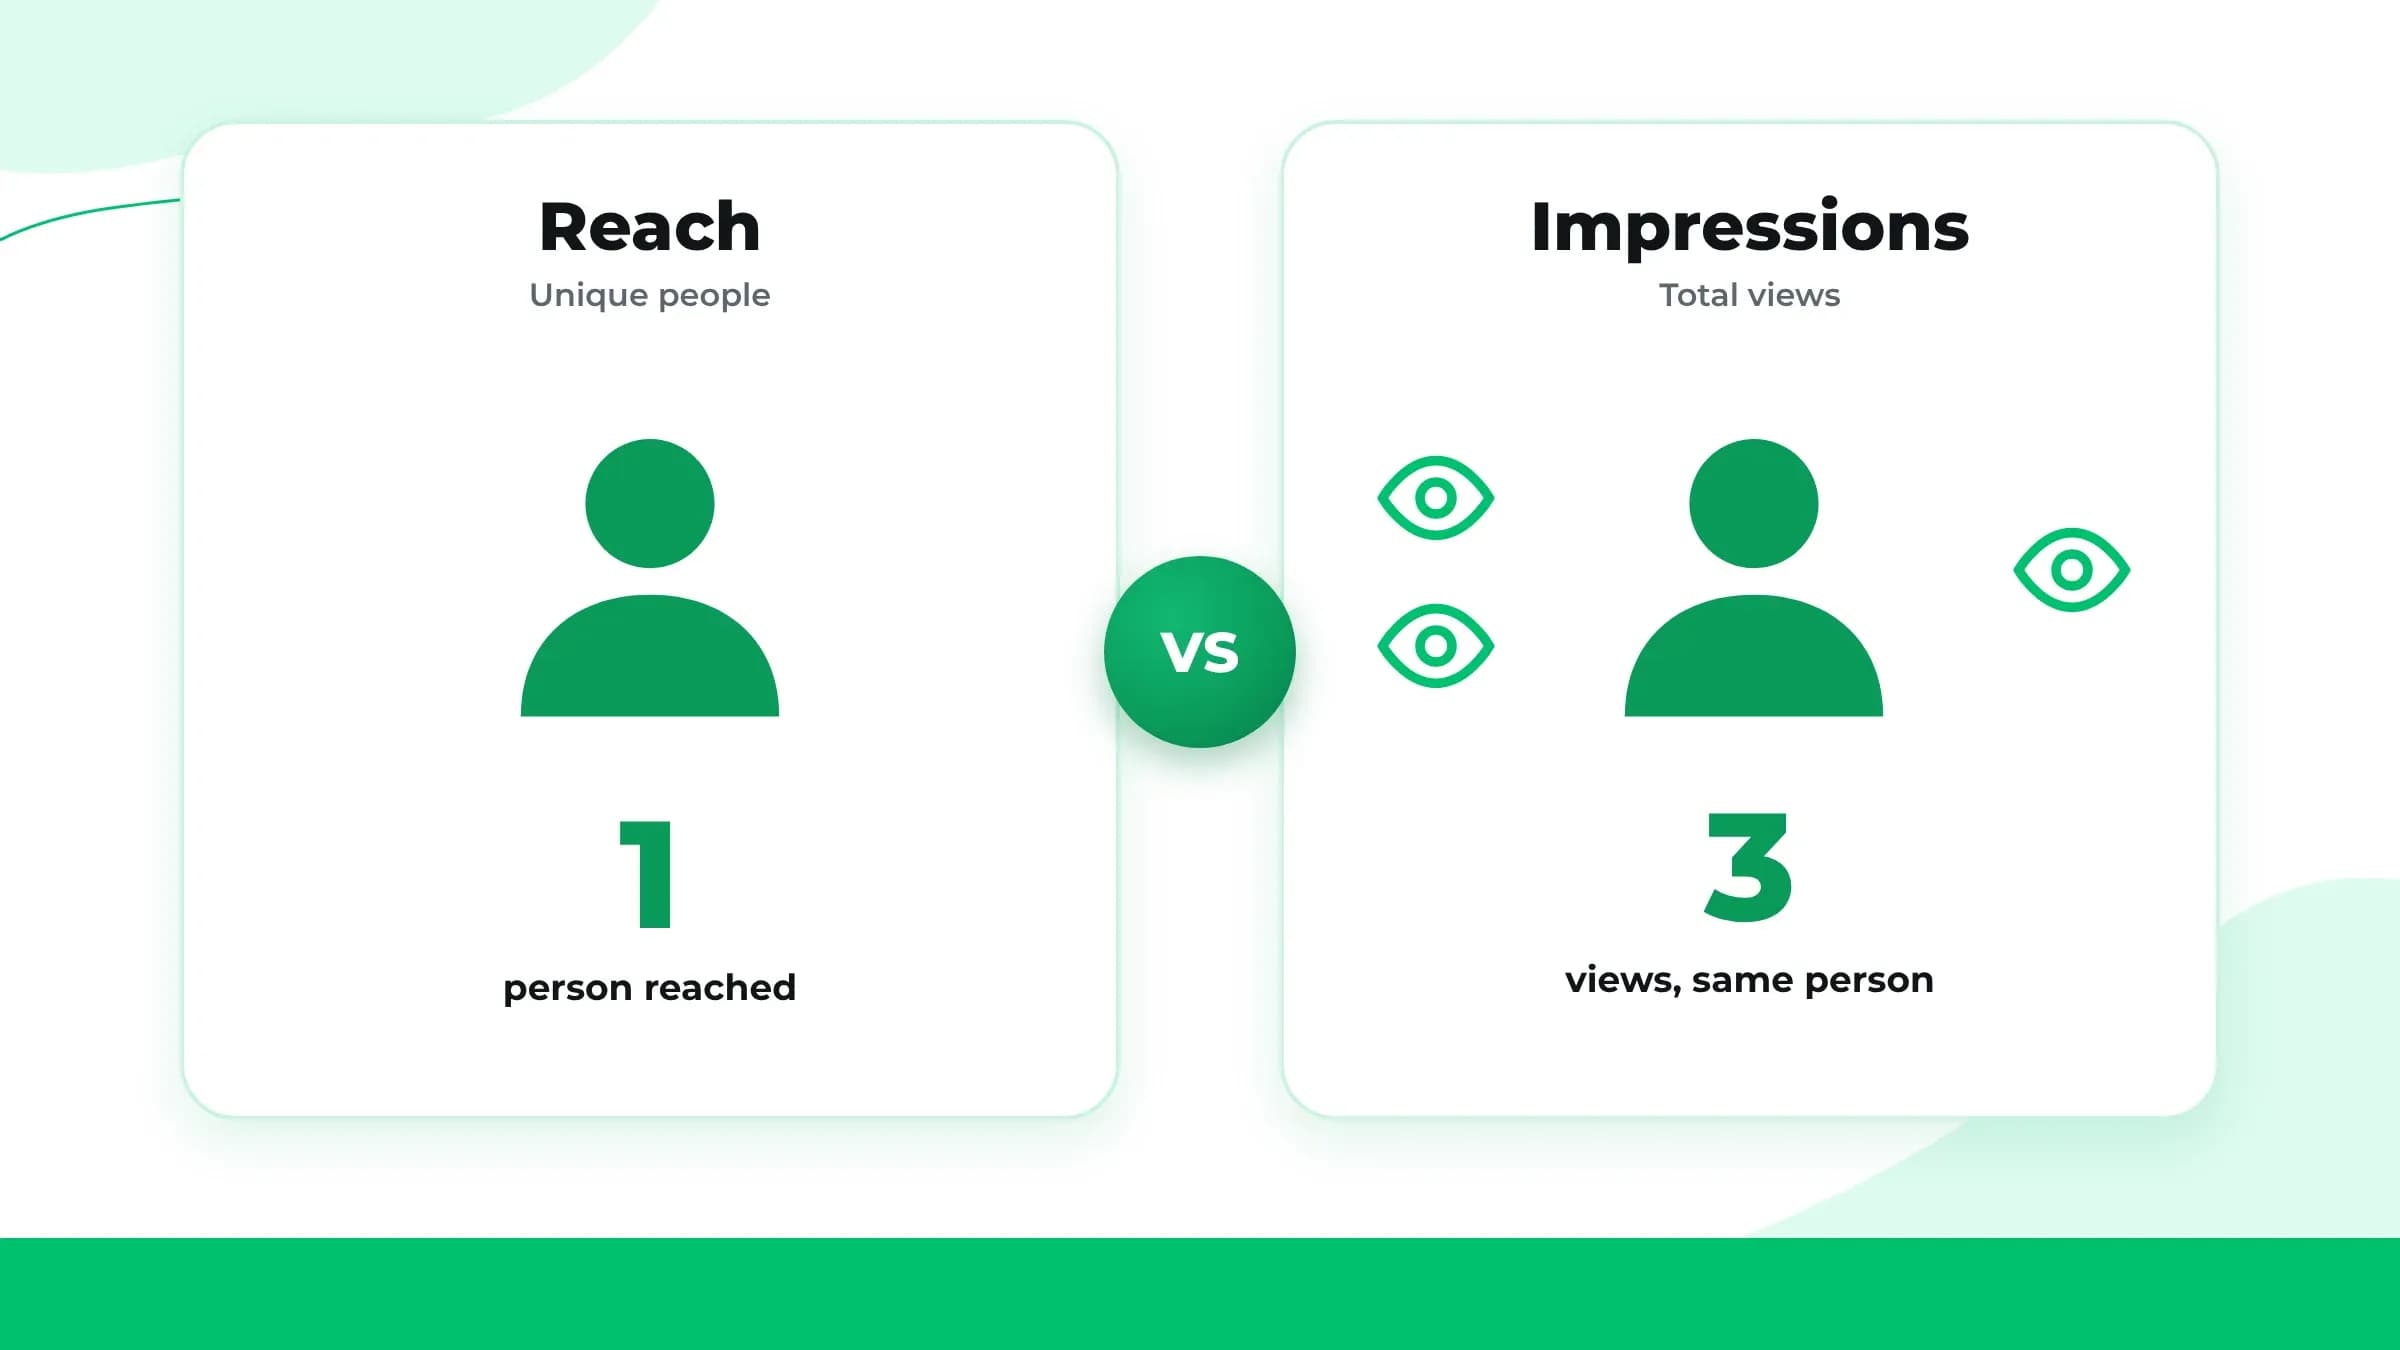
Reach counts the total number of unique viewers for your content. Repeat views by the same individual do not inflate this number.
▶When to Use It: Prioritize reach for product launches. Use reach for brand awareness campaigns. Focus on reach during new market entries. It answers whether you are reaching new audiences.
▶Organic Reality: Organic reach is difficult to earn without paid promotion. According to Sprout Social, average reach rates on Instagram have dropped roughly 12% year over year, with typical posts now reaching only 3 to 4% of an account's total followers.
Impressions
Impressions count the total displays of your content. This number includes multiple views by the exact same person.
▶Reach Versus Impressions: One person might view a post three times. That action registers as three impressions. It registers as only one unit of reach.
▶Algorithmic Insight: A high impression count alongside flat reach signals an algorithm pattern. The algorithm repeatedly shows content to a small group. It does not drive new discoveries.
▶Primary Use: Impressions are mainly useful for tracking content frequency. They help verify brand recall.
Follower Growth Rate
Follower growth rate measures audience expansion speed over a specific timeframe. You calculate it as a percentage rate rather than a raw count.
▶Why Percentages Matter: Raw numbers hide account momentum. Gaining 200 followers represents a weak 0.2% growth rate for an account with 100,000 followers. Gaining 200 followers represents a massive 10% growth rate for an account with 2,000 followers.
▶Weak KPI Warning: Tracking raw follower counts rewards sheer account size over active momentum. Checking current platform statistics puts your own growth rate in context, since a number alone reveals nothing about ongoing audience health.
Ready to turn clicks into leads? Buy LinkedIn followers and strengthen the audience behind every conversion push.
The KPIs Behind Social Media Engagement
Engagement KPIs measure active responses instead of plain views. They show if your content connects with people instead of getting ignored. Platforms like Instagram prioritize saves and shares when building feeds. Strong engagement directly increases your overall reach.
Engagement Rate
Engagement rate tracks total actions divided by total reach or impressions. Total actions combine likes, comments, shares, and saves. This calculation shows real content connection based on total audience size. It prevents raw numbers from skewing your analysis.
▶Raw Count vs. True Rate: 500 likes across 500,000 viewers results in a weak 0.1% rate. 200 likes across 2,000 viewers produces a much higher 10% rate.
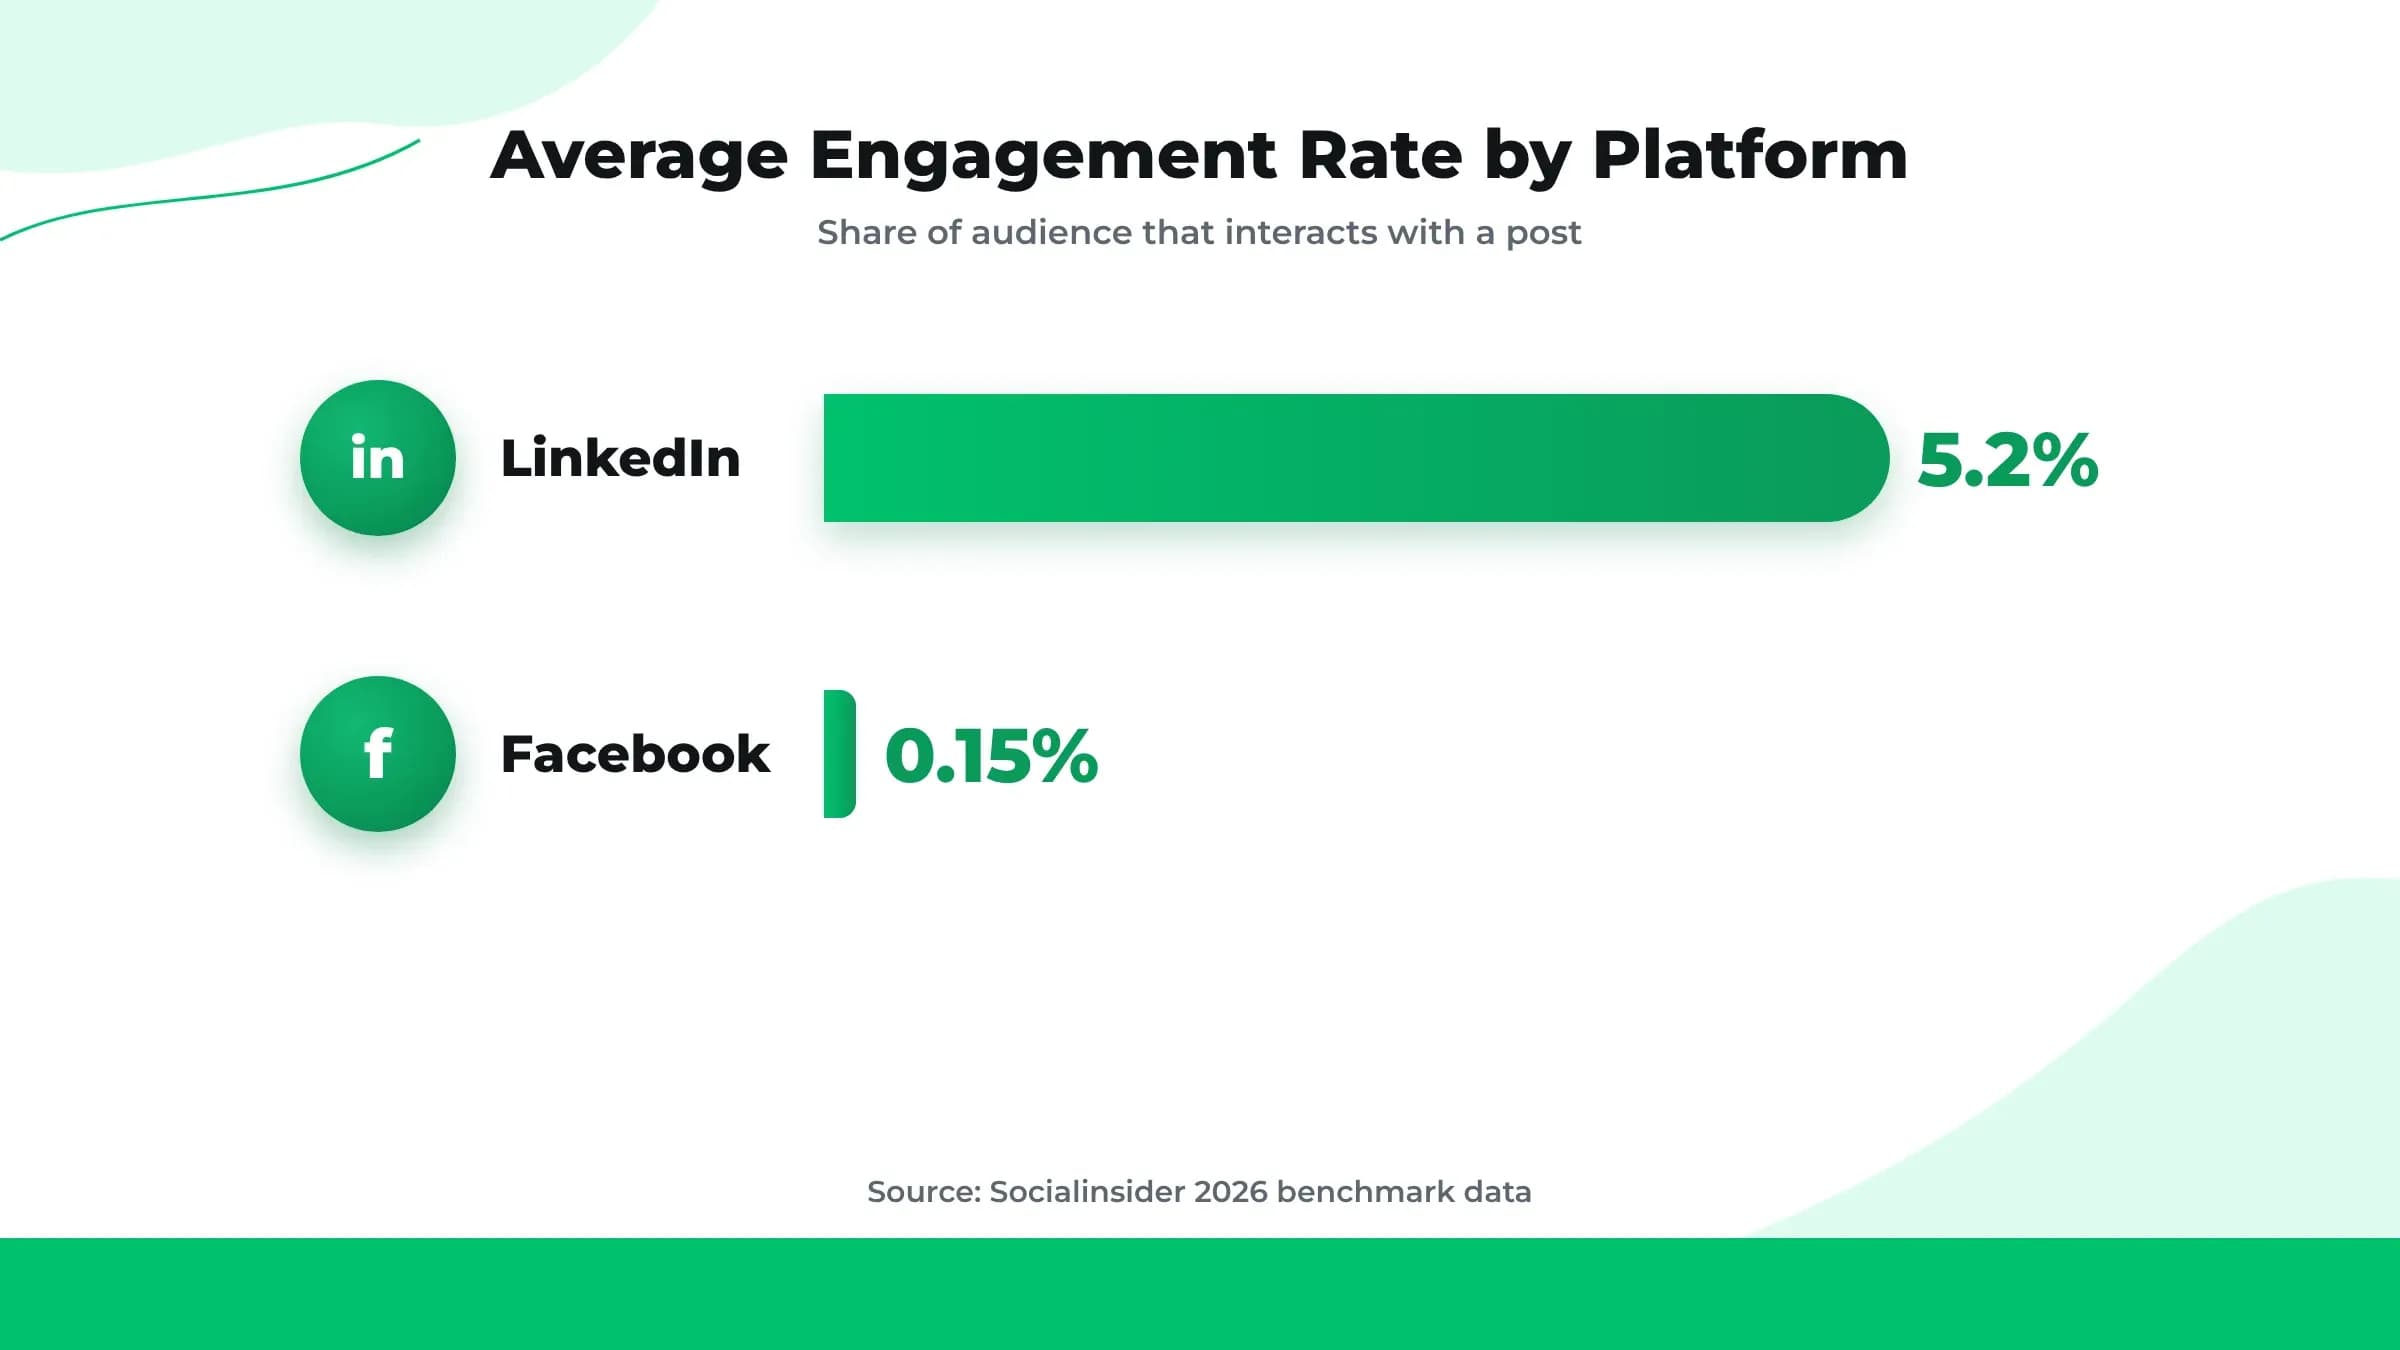
▶LinkedIn Benchmark: LinkedIn reaches an average 5.2% engagement rate on image posts, topping major social channels according to Socialinsider's 2026 benchmark data.
▶Facebook Benchmark: Facebook scores an average 0.15% engagement rate in the same report.
▶Strategic Focus: Focus your benchmarks on your own platform and industry standards. Do not chase fixed targets.
Shares and Saves
Shares and saves reflect clear user intent. They demand far more thought than quick double taps.
▶High-Intent Signals: A share acts as a personal endorsement to a user's network. A save marks high utility for later use.
▶Algorithmic Weight:Instagram head Adam Mosseri has confirmed that sends per reach, how often people share a post to a friend via DM, is one of the platform's most important ranking signals.
▶Data Precision: Record shares and saves as separate numbers, the same way you'd separate simple TikTok likes from a genuine save. Do not merge them into one overall engagement count.
Video Completion Rate
Video completion rate tracks viewers watching a video to the very end. It also calculates the average percentage of total video length watched.
▶Duration Benchmarks: Data analyzing over 13 million videos reveals clear trends. Videos under 1 minute average a 52% completion rate.
▶Attention Curves: Viewers naturally drop off during longer videos. A 10 minute video operates under a different attention pattern. Do not judge it by 15 second video standards.
▶Performance Auditing: Audit your completion metrics against your own channel history. Limit comparisons to videos of similar length.
Revenue and Conversion KPIs for Social Media
Conversion and revenue KPIs measure whether social media activity is actually driving business outcomes, not just attention. This is the category that connects your social media work to results the rest of the company cares about, and it's where social media ROI KPIs live.
Click Through Rate
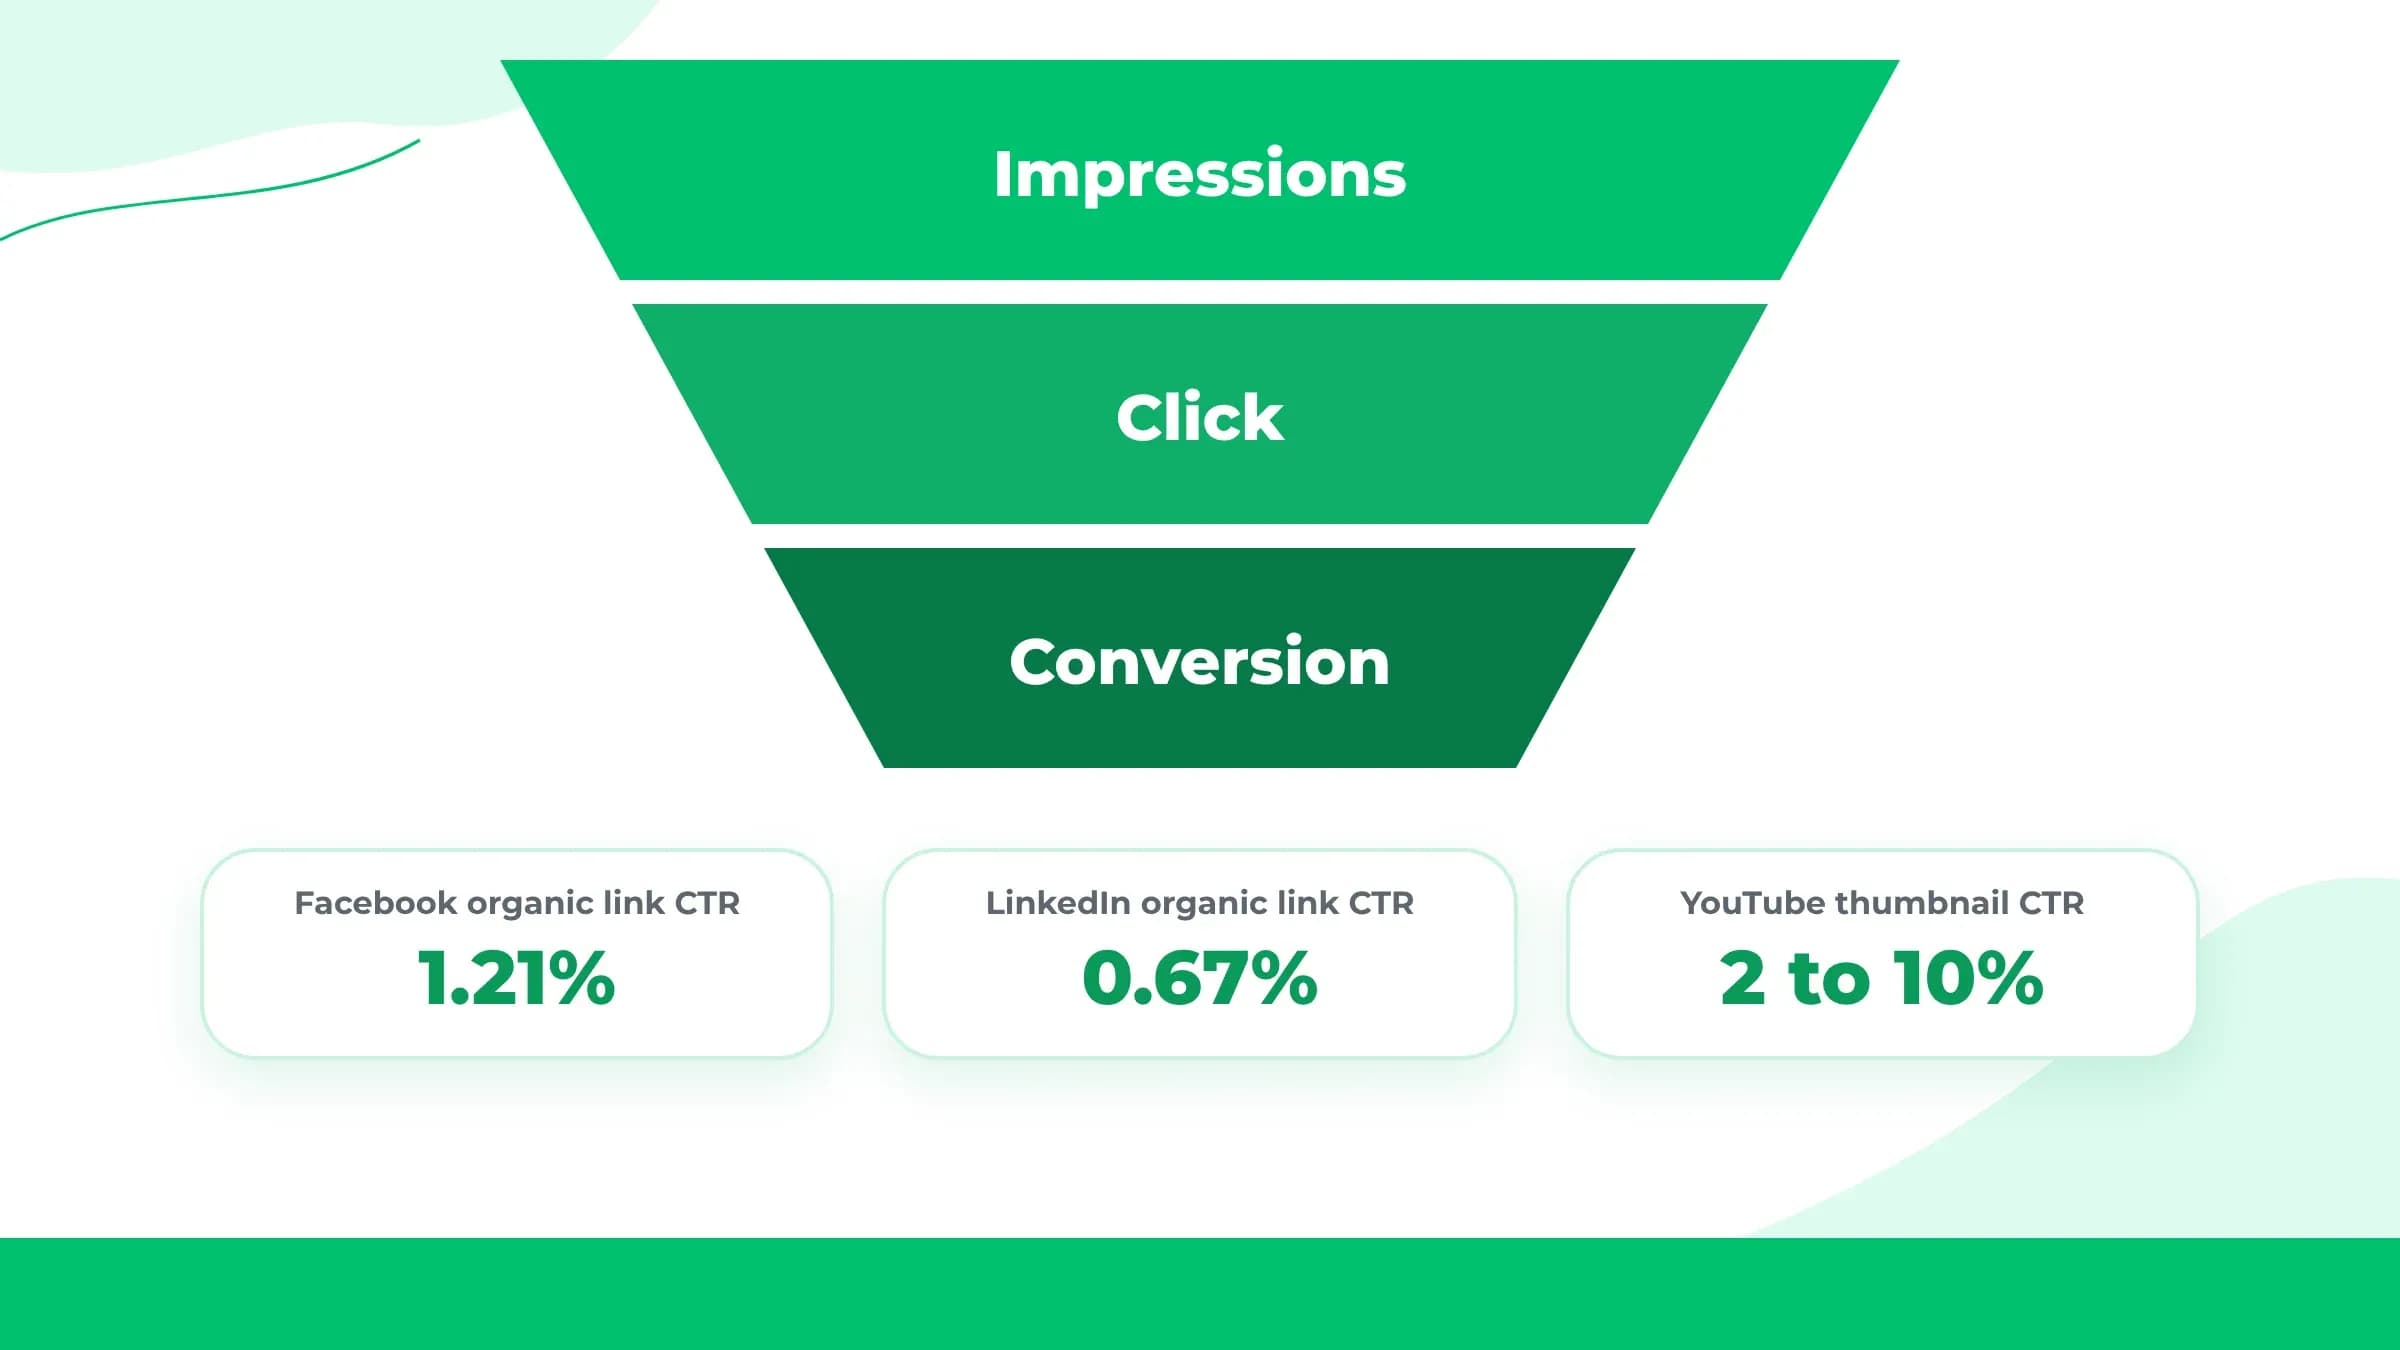
Click through rate measures link clicks to your website. It tracks traffic moving from social media to your website. High engagement numbers mean very little without website traffic. Your posts must successfully generate website visits. Compare your numbers against standard platform baselines.
Conversion rate measures actual business results after the click. These outcomes include email signups and product purchases. Your success relies entirely on your tracking setup, whether you're measuring form fills or YouTube subscriber growth. Audit your tracking tools on a regular schedule. A broken tracking pixel reports zero conversions during active sales.
Social Media ROI
Social media ROI compares total revenue to total operational costs. These expenses include ad spend, software tools, and team salaries. Clear ROI tracking satisfies business leadership requirements. According to the 2025 Sprout Social Index, 65% of marketing leaders say they need to prove how social media supports business goals to secure leadership buy-in.
Turn Your KPI Targets Into Real Results
Browse SocialPlug growth services and give your campaigns the reach and engagement they need to hit their targets.
Customer Care Metrics That Drive Customer Loyalty and Retain Revenue
Customer care KPIs measure how well a brand responds to and resolves customer questions and complaints on social media. They matter most for any brand where customers expect to reach a real person through a DM or comment, not just a phone line.
Response Time
Response time tracks the exact minutes your team takes to answer a customer's first social media message. Social media users want fast replies. This speed directly controls customer retention and sales numbers.
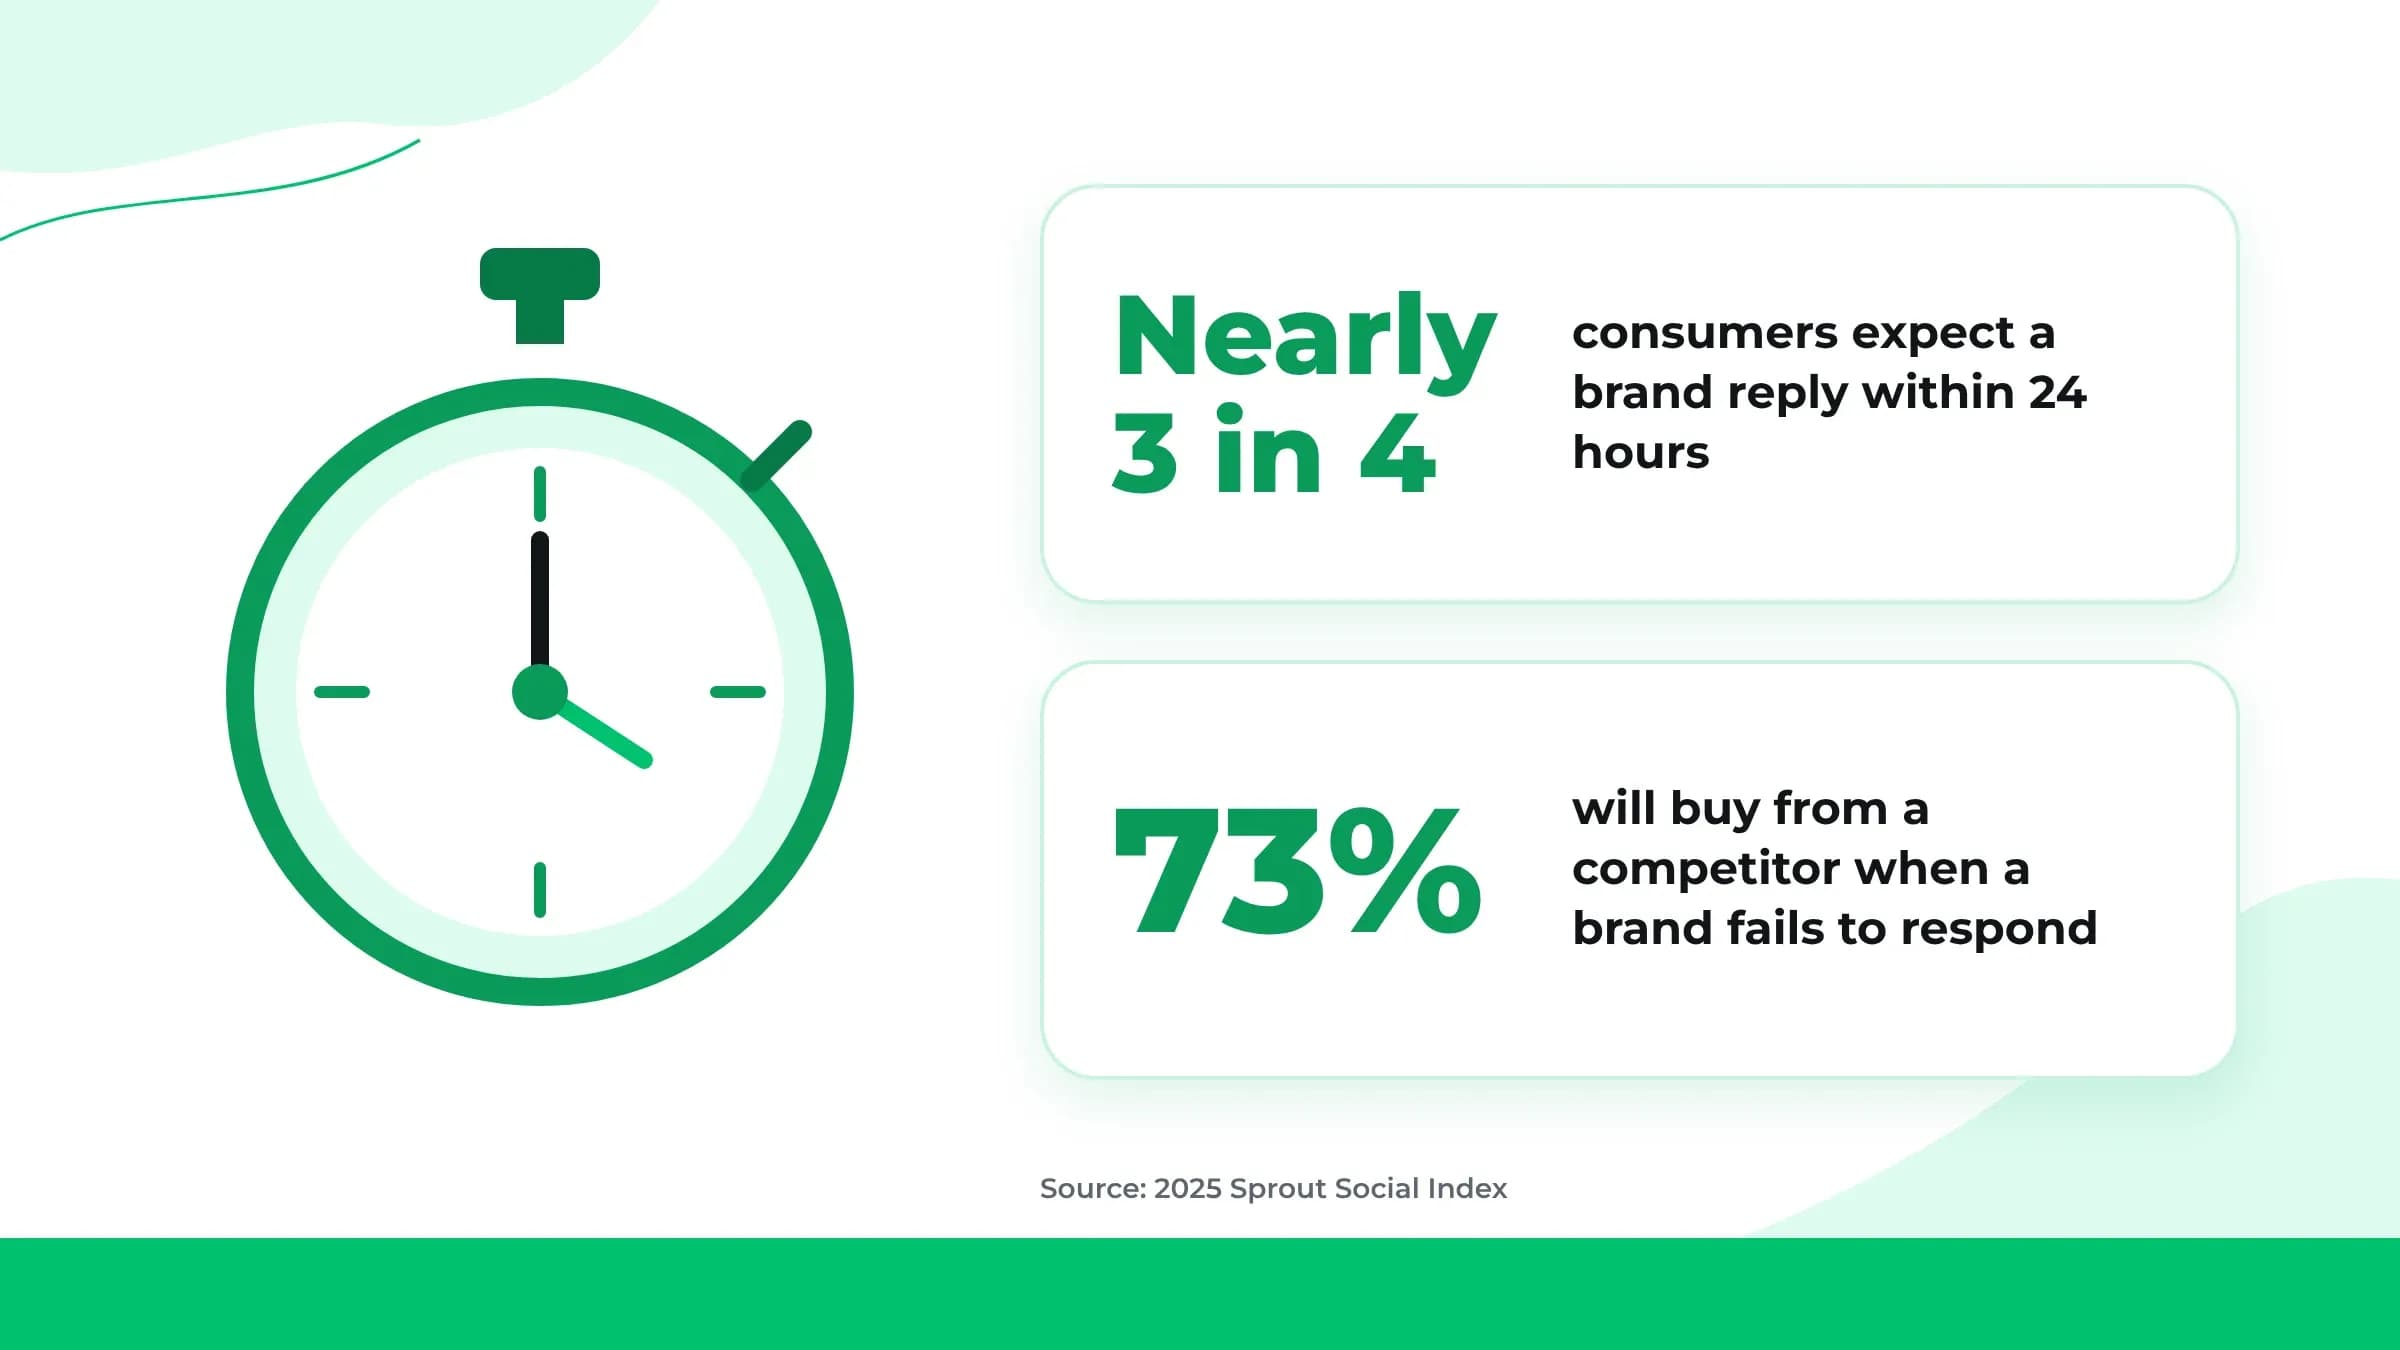
▶Customer Expectations: The 2025 Sprout Social Index found nearly three-quarters of consumers expect a company reply within 24 hours or sooner.
▶Revenue Risk: The same research found that 73% of social media users will buy from a direct competitor when a brand fails to respond.
▶Strategic Takeaway: Response time acts as an active driver for company income. Do not treat it like a hidden support number in a monthly report.
Resolution Rate
Resolution rate records the percentage of customer complaints that your team fixes completely. It looks past a simple initial answer.
▶Quality vs. Speed: A quick first message does not solve the main issue. Answering fast without fixing the problem makes customers angry.
▶Complete Outcomes: This KPI checks if the support conversation delivered a real solution.
▶Performance Auditing: Measure your resolution rate right next to your response time, whether support uses DMs or Reddit conversations. Using both numbers reveals if your social customer care truly works.
Keep your top numbers moving while you focus on strategy. Buy Reddit upvotes and give your posts real traction.
Building a Goal-Driven KPI Strategy for Social Media Growth
The right KPIs depend on the specific goal behind a campaign or account. There is no fixed list of the best social media KPIs for every brand. The KPIs you pick must come directly from what you want to achieve. Do not just pick numbers sitting at the top of a dashboard.
Figure Out Your Goal First
Stop opening analytics dashboards just to collect big numbers. Write your main goal down on paper using plain words. Do this before looking at data. Pick the exact metrics measuring that specific goal.
Select KPIs That Match Your Goal
Each goal requires its own set of metrics.
▶Brand Awareness: Look at reach, impressions, and follower growth rate. They prove if new people see your brand.
▶Community Building: Watch engagement rate, shares, and saves. They show if followers stop and read your posts.
▶Lead Generation and Sales: Use click through rate, conversion rate, and social media ROI. They show if social posts bring real money.
▶Customer Support: Check response time and resolution rate. They show if your support team fixes user problems.
Track Only a Few KPIs per Goal
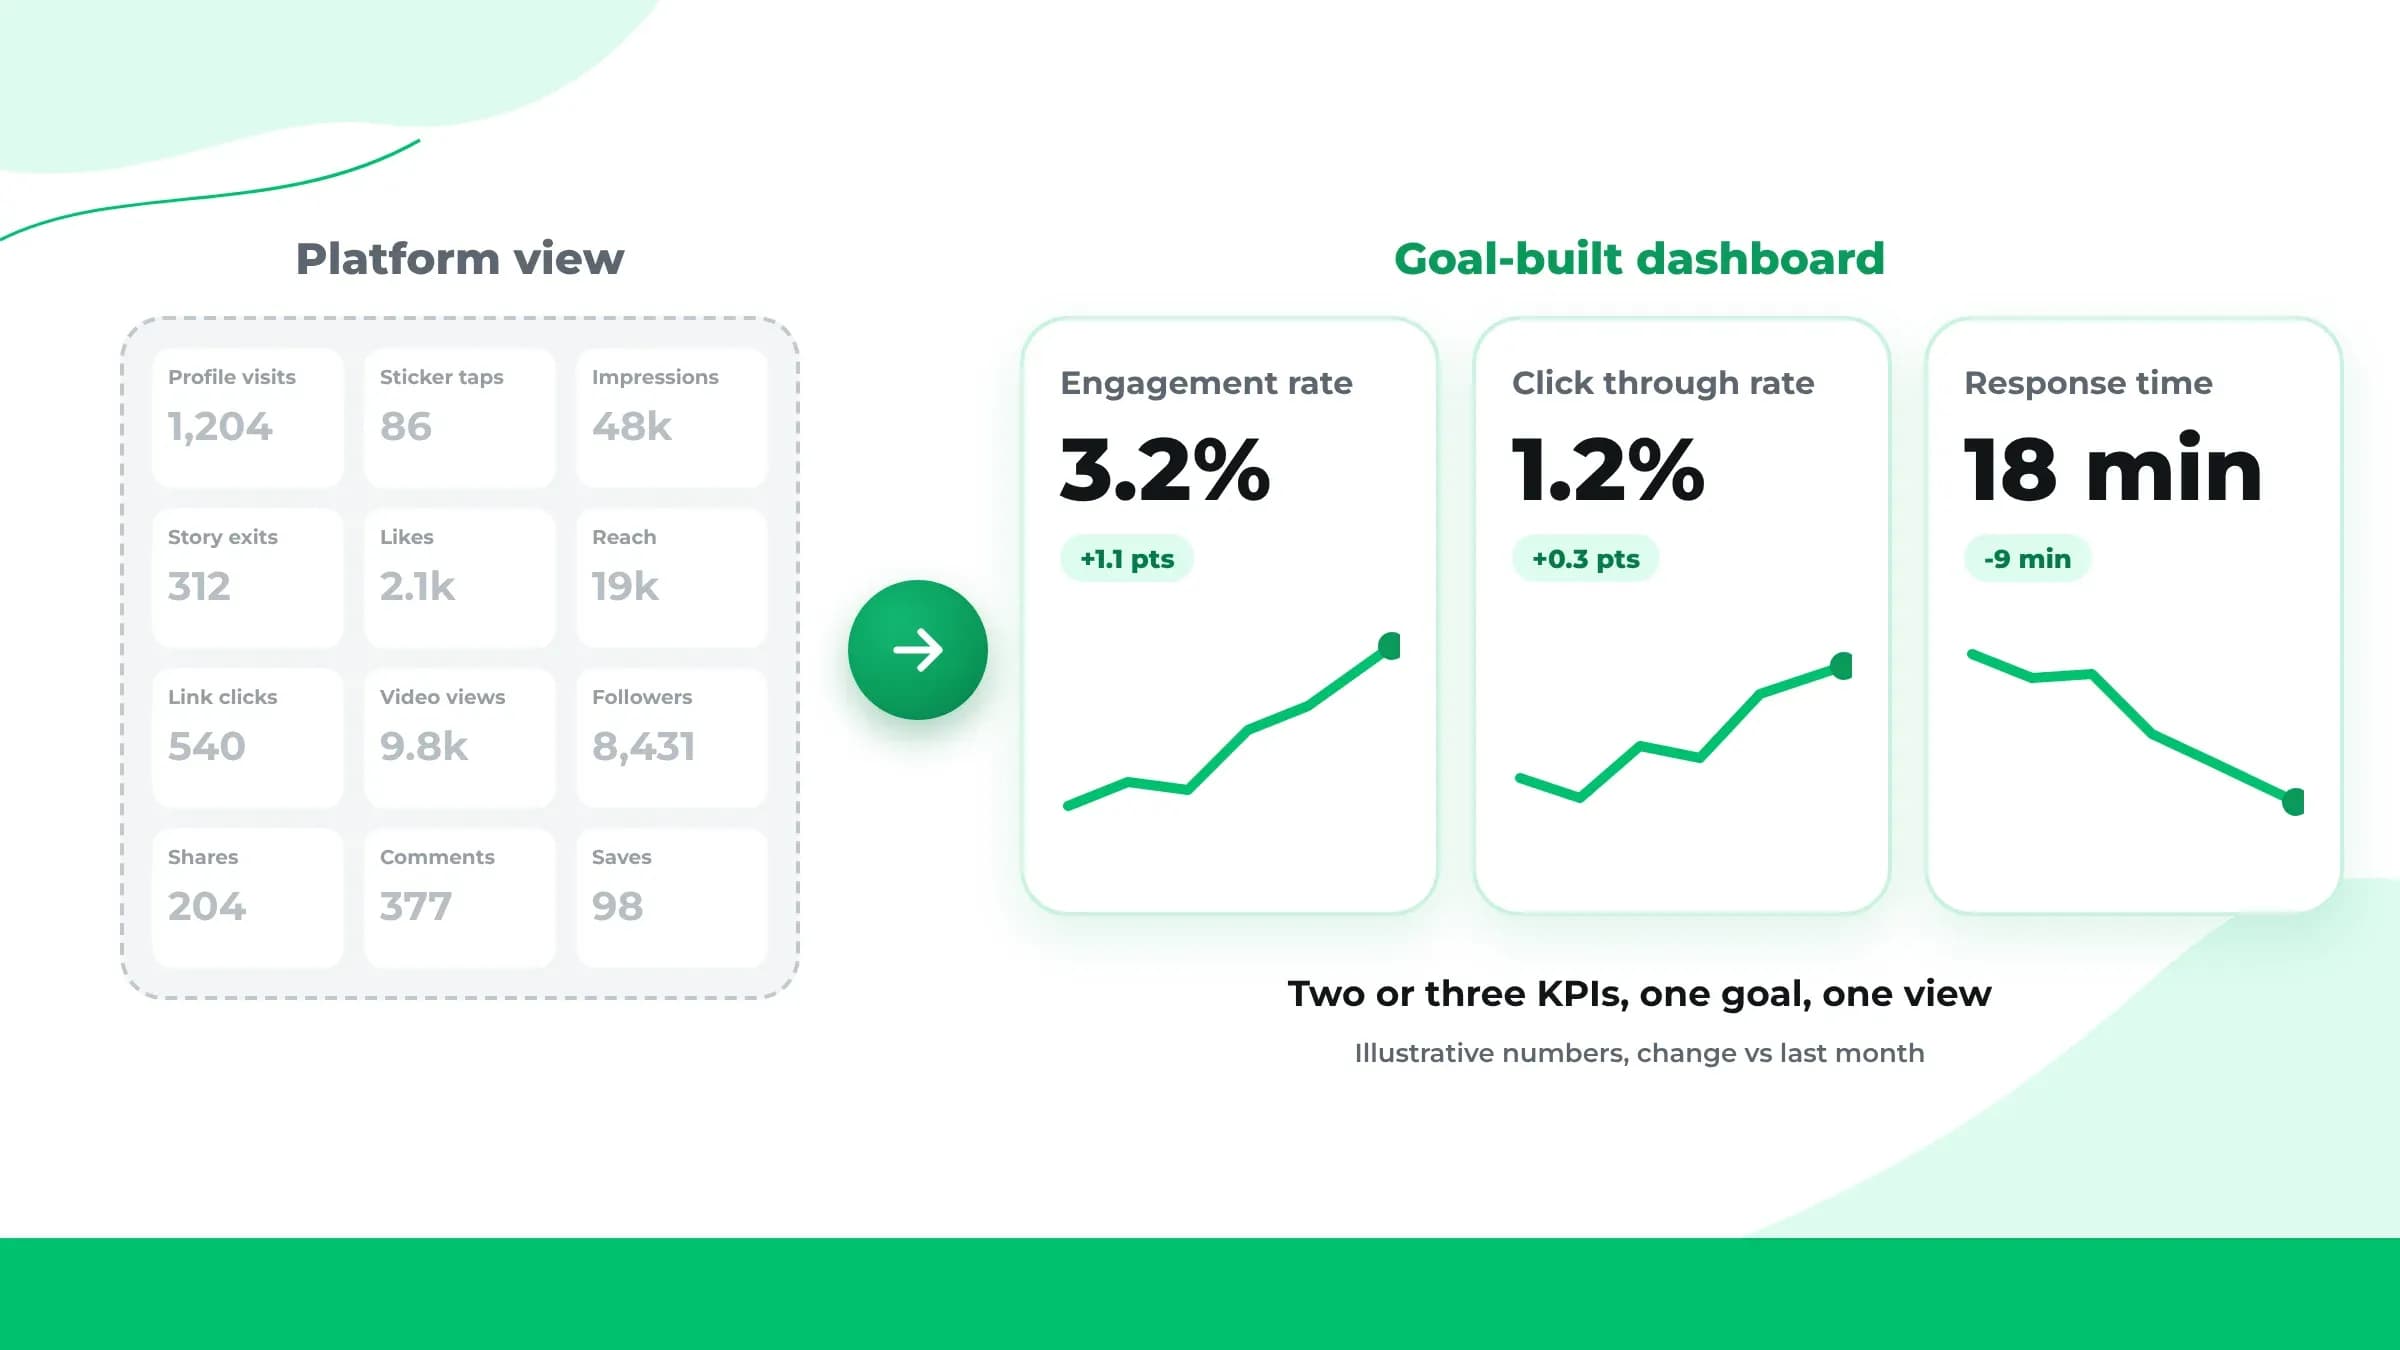
Collecting every single number leads to confusing reports. It wastes your time. Choose only two or three core KPIs for each active goal. This keeps your reports clear and easy to use.
Update Your KPIs as Goals Shift
Update your metrics as your social accounts grow over time.
▶Early Stage: Focus on awareness metrics when setting up a profile, since audience usage trends shift fast.
▶Growth Stage: Switch to engagement metrics after building a loyal group.
▶Conversion Stage: Target conversion rates and ROI as you run ad campaigns.
▶Multi Account Management: Managing multiple accounts with changing goals gets hard. Goal aligned KPI structures give you clean performance reviews.
Build a community that talks back fast. Buy Telegram members and give customers a responsive place to land.
Social Media KPI Reporting Best Practices
Tracking and reporting social media KPIs well means pulling consistent data on a regular schedule and presenting it so stakeholders can act on it. The value comes from consistency. Checking the same numbers at the same intervals is what makes a trend visible, instead of leaving it buried in a one-off snapshot.
Pick a Regular Schedule
Consistent schedules show real performance trends clearly. They prevent important data from hiding in single snapshots.
▶Schedule Impact: Imagine a campaign starting in week one. Performance drops in week two. Performance recovers in week three. Weekly reports spot that week two drop easily. Switching to a quarterly report averages all three weeks together. The quarterly report hides the drop completely. Your team never learns the cause of the drop.
▶Choosing the Schedule: Teams with active campaigns review data weekly. Teams with steady ongoing accounts use monthly reviews.
Keep the Same Metrics
Pick your KPIs using your main goal. Track those exact metrics in every report.
▶The Danger of Swapping: Changing your metrics every month hurts your progress. Do not swap engagement rate for click through rate. Swapping metrics ruins historical data comparisons. It hides real long term trends.
▶Focusing on Consistency: Consistency matters more than metric variety. A different metric might look better for one month. Stick to your original metrics anyway.
Build a Simple Dashboard
A simple dashboard removes unnecessary platform clutter. It shows your chosen metrics clearly in one central spot.
Standard platform tools show dozens of useless stats. These stats include profile visits and sticker taps. A goal built dashboard displays only key metrics. It highlights two or three vital stats for fast reading.
Show Trends Over Time
A single monthly number provides very little context. You need historical comparisons.
Tracking trends across several months catches problems early. You might spot a slow drop in reach over three months. A single month snapshot hides that steady drop.
Mistakes to Avoid With KPI Tracking
Understanding KPIs well doesn't stop marketers from falling into the same traps repeatedly. These aren't about picking the wrong KPI. They're about how KPIs get tracked and reported day-to-day, often by people who know better and still slip into them.
Tracking Too Many Metrics
Tracking every metric backfires quickly. Reports become crowded with numbers.
A report with 15 different metrics confuses readers. Readers must guess the important numbers. Most readers skim past crowded reports. Stick to two or three core KPIs for your main goal.
Focusing Only on Followers
Follower counts are easy to find. They often mislead marketing teams.
▶Vanity Metric Risk:Improvado's analysis identifies follower count as a classic vanity metric, one that looks impressive but doesn't directly correlate with revenue or conversion outcomes.
▶Business Impact: Picture a brand with 100,000 followers and zero revenue. That brand suffers worse health than a small sales driving account. Use follower counts in brand awareness reports only. Do not make followers the primary metric for every account.
Changing Metrics Too Often
Switching metrics often feels like optimization. It actually destroys your ability to track growth.
Stick to your chosen KPIs for a full reporting cycle. Change your KPIs only during an actual business goal shift.
Reporting Numbers Alone
A lone metric without targets tells very little. You need past benchmarks or clear targets.
Example: A 3.2% engagement rate means very little by itself. Compare that 3.2% result to a previous 2.1% score. Compare it to a 3% target. This comparison tells a full story.
Final Words
The best social media KPIs connect directly to a real business goal instead of default dashboard metrics. Each metric category measures a distinct outcome. Awareness tracks visibility, engagement measures audience interest, conversion calculates revenue, and customer care evaluates support speed. You must identify your immediate business priority before picking numbers.
Chasing every single number creates very long reports. These long reports say very little to your team. Picking two or three social media KPIs creates better reports. Clear reports help your team take real action.
Start your work with a clear business goal. Select social media KPIs matching that goal. Stay consistent with your chosen metrics over time. Steady tracking reveals real performance trends.
See every growth service built to support real KPIs.
Check your KPIs weekly during active campaigns. Monthly checks work fine for steady accounts without major launches.
Do social media KPIs differ by platform?
Yes. Platforms differ in small ways. TikTok focuses on video content. TikTok values video completion rates heavily. X focuses on text content. Text platforms prioritize different metrics.
Can a small business use the same KPIs as a large brand?
Yes. The main categories stay the same for both. Small businesses set smaller target numbers. Smaller budgets and audiences lead to smaller targets.
Should I set a target number for each KPI, or just track the trend?
Try to do both. A target gives you a clear goal. The trend shows your direction over time. It proves your progress between check ins.
What should I do if a KPI stays flat for several months?
Do not switch KPIs right away. Look at changes in your content first. Review your strategy changes. A flat KPI signals a need for a new marketing approach. It does not mean changing your measurement method.
Tasnim is a content and digital marketer born in Dhaka, Bangladesh. For over thirteen years, Tasnim has worked as a freelancer for several social media marketing companies. He has acquired skill sets in copywriting, content marketing, SEO & social media marketing. He’s one of the founding members of SEOSkit, a very exciting search engine marketing startup. In his free time he likes to travel, read, and make failed attempts at music.















0 Comments