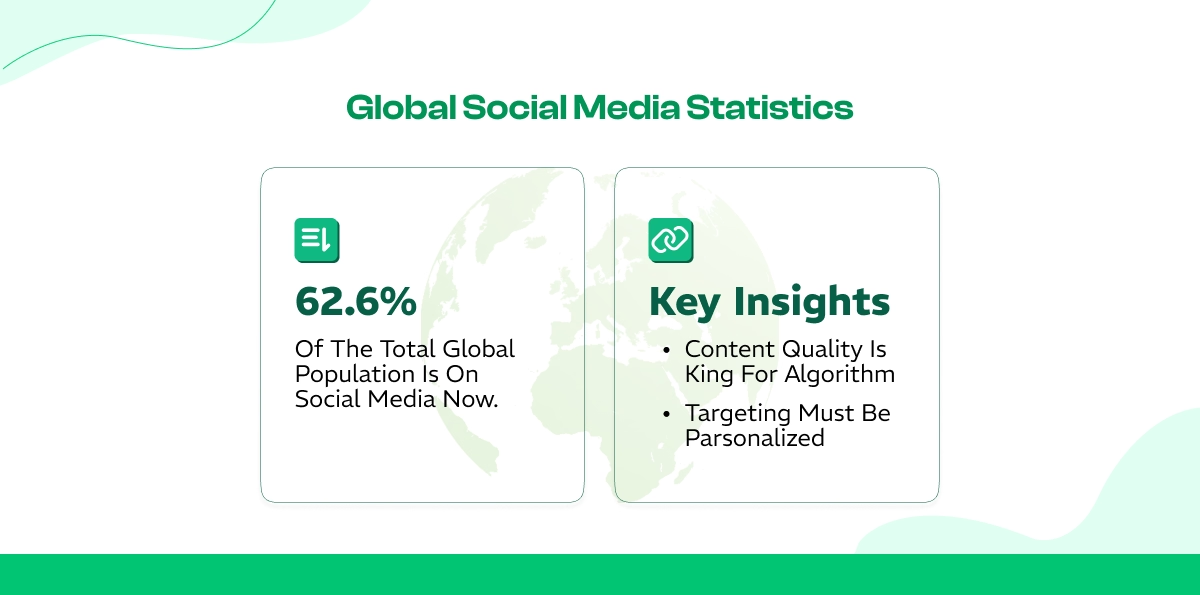
Social media stopped being a marketing channel years ago. It became the primary way brands earn attention, trust, and revenue. 62.6% of the total global population is on social media right now.
In 2026, over 5.66 billion people are active across platforms, and the competition for their attention has never been sharper. Short-form video now drives the majority of engagement, while AI is reshaping how algorithms reward content!
For marketers, this is not a moment to guess. It is a moment to know exactly where your audience spends time, what format they respond to, and which platform actually converts.
This data-backed guide breaks down the real numbers behind today's social media platforms statistics.
You’ll learn everything from user growth and engagement rates to ad costs and demographic shifts. It will help you build a strategy backed by data instead of assumptions.
If you want to grow your business and maximize the revenues, check Socialplug’s services today!
▶
As of 2026, various global statistics indicate that the total number of social media users has exceeded 5.6 billion.
▶
Asia is leading in growth, with an increase rate of 4.8%. [Source: SEO Sherpa]
▶
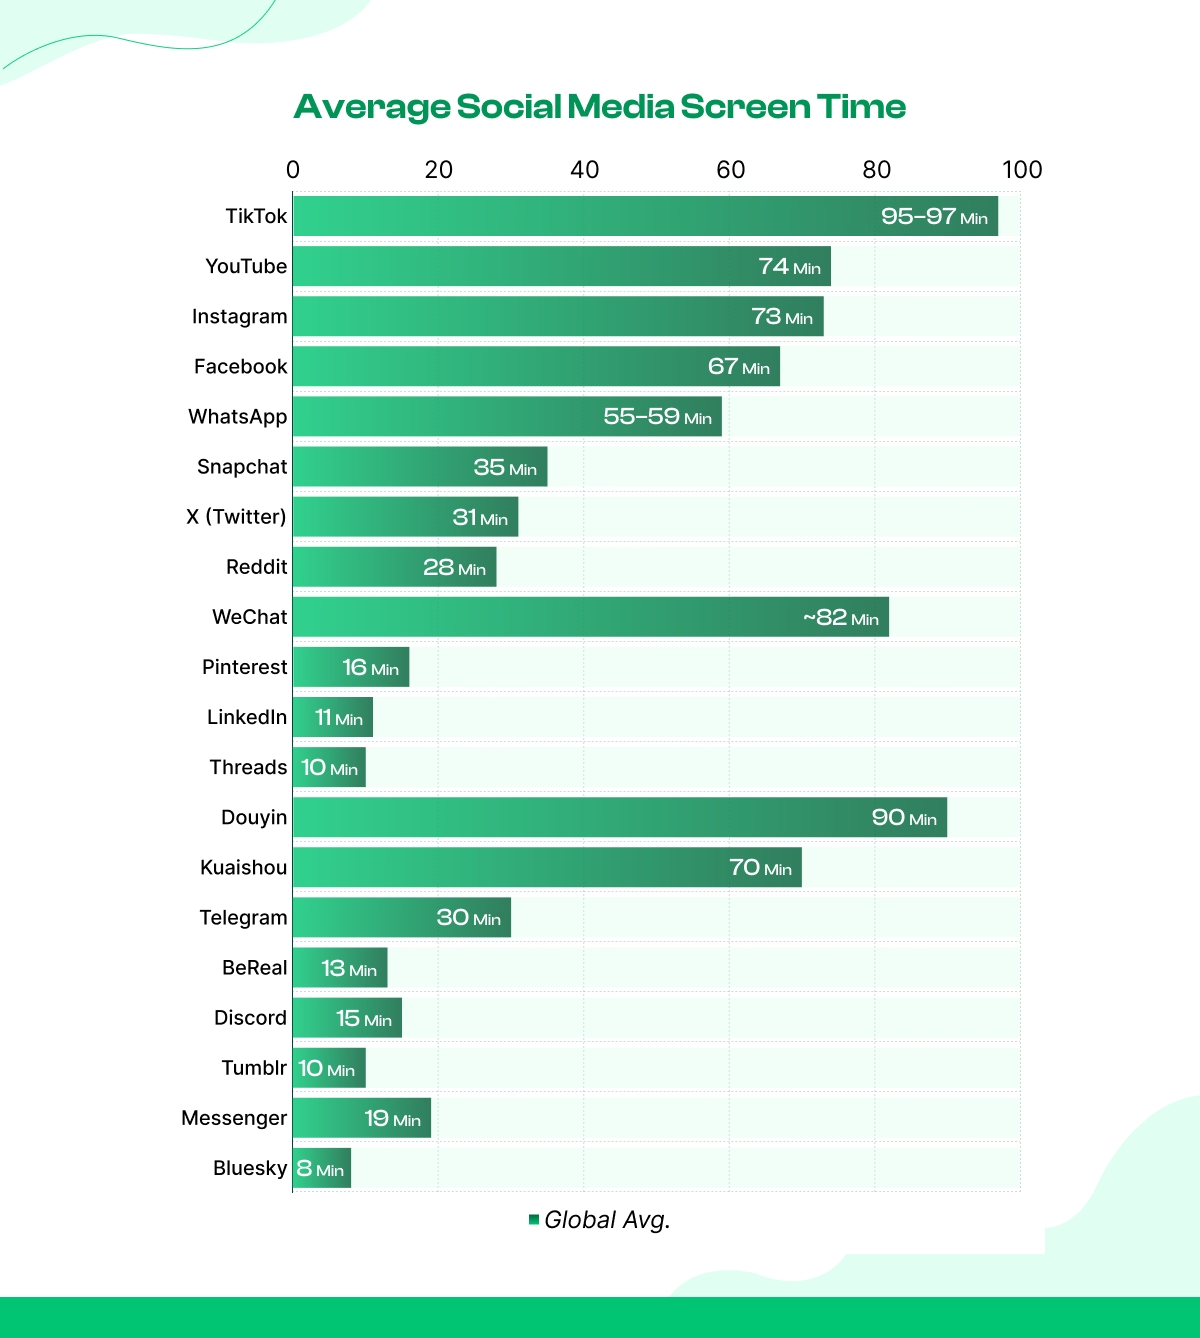
On average, users spend at least 2 hours and 28 minutes daily on social media, with 80% accessing it via mobile devices. [Source: New Media]
▶
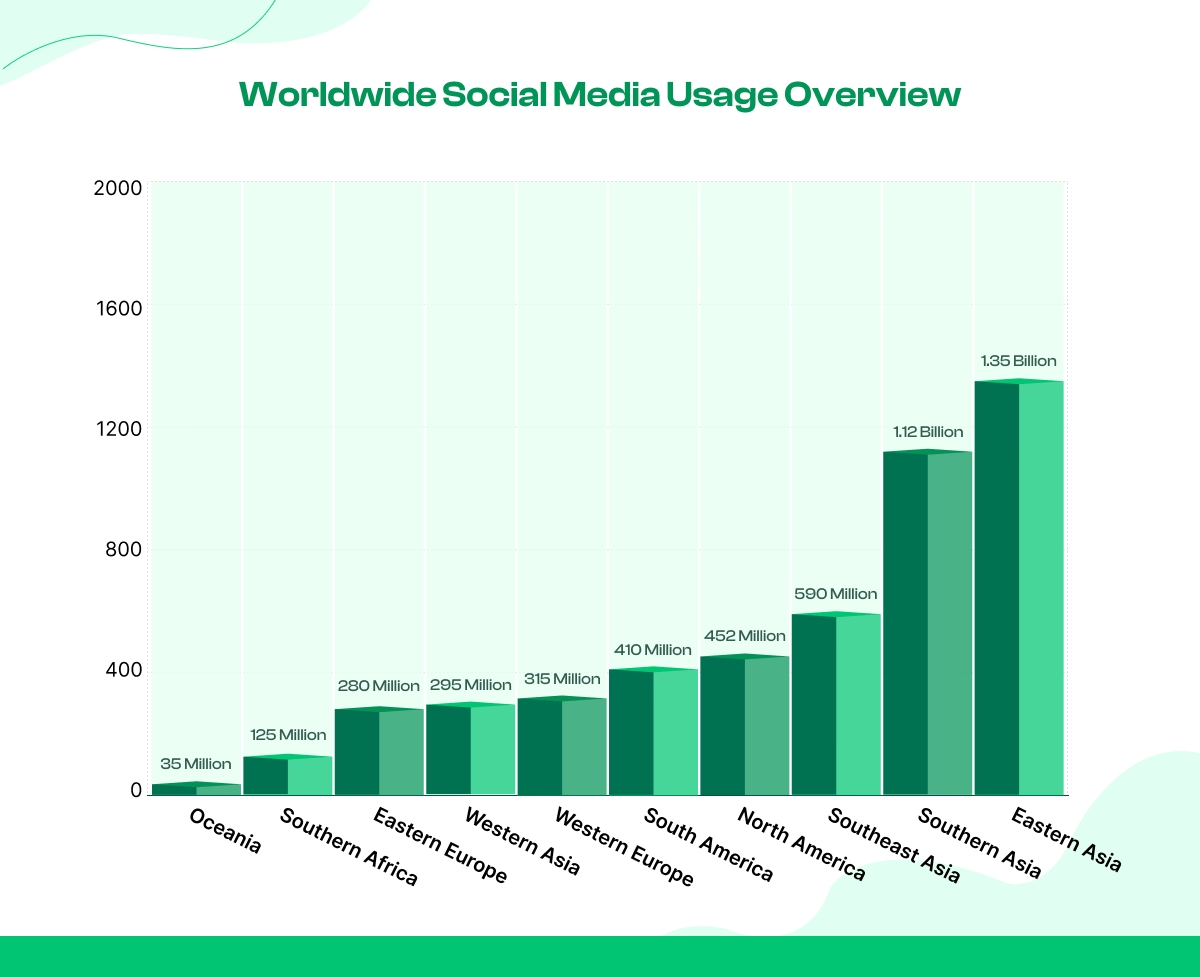
Eastern and Southern Asia represent the largest segments of this digital population.
▶
The global coverage of social networks is projected to grow at a rate of 4.8%.
▶
75% of global users prefer short-form videos (MP4 format, standard aspect ratio of 9:16) over longer formats.
▶
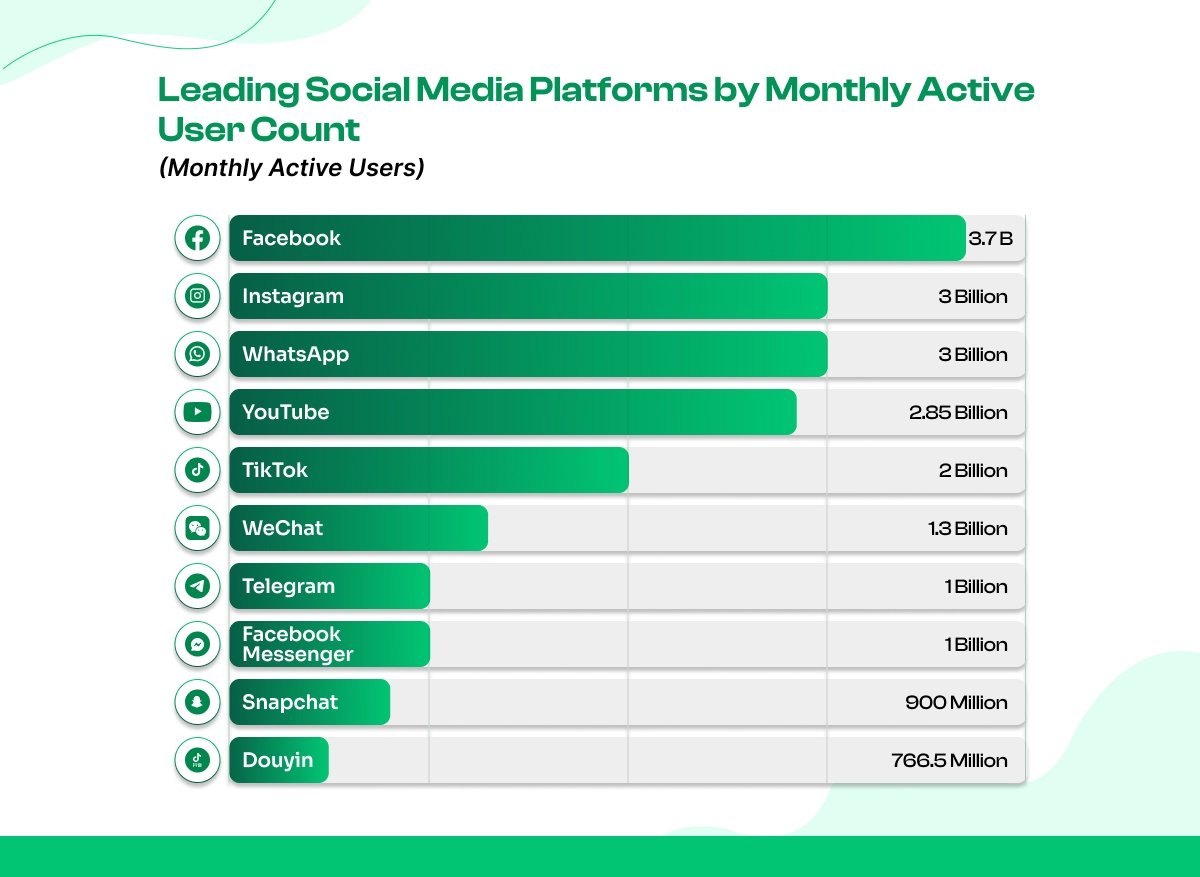
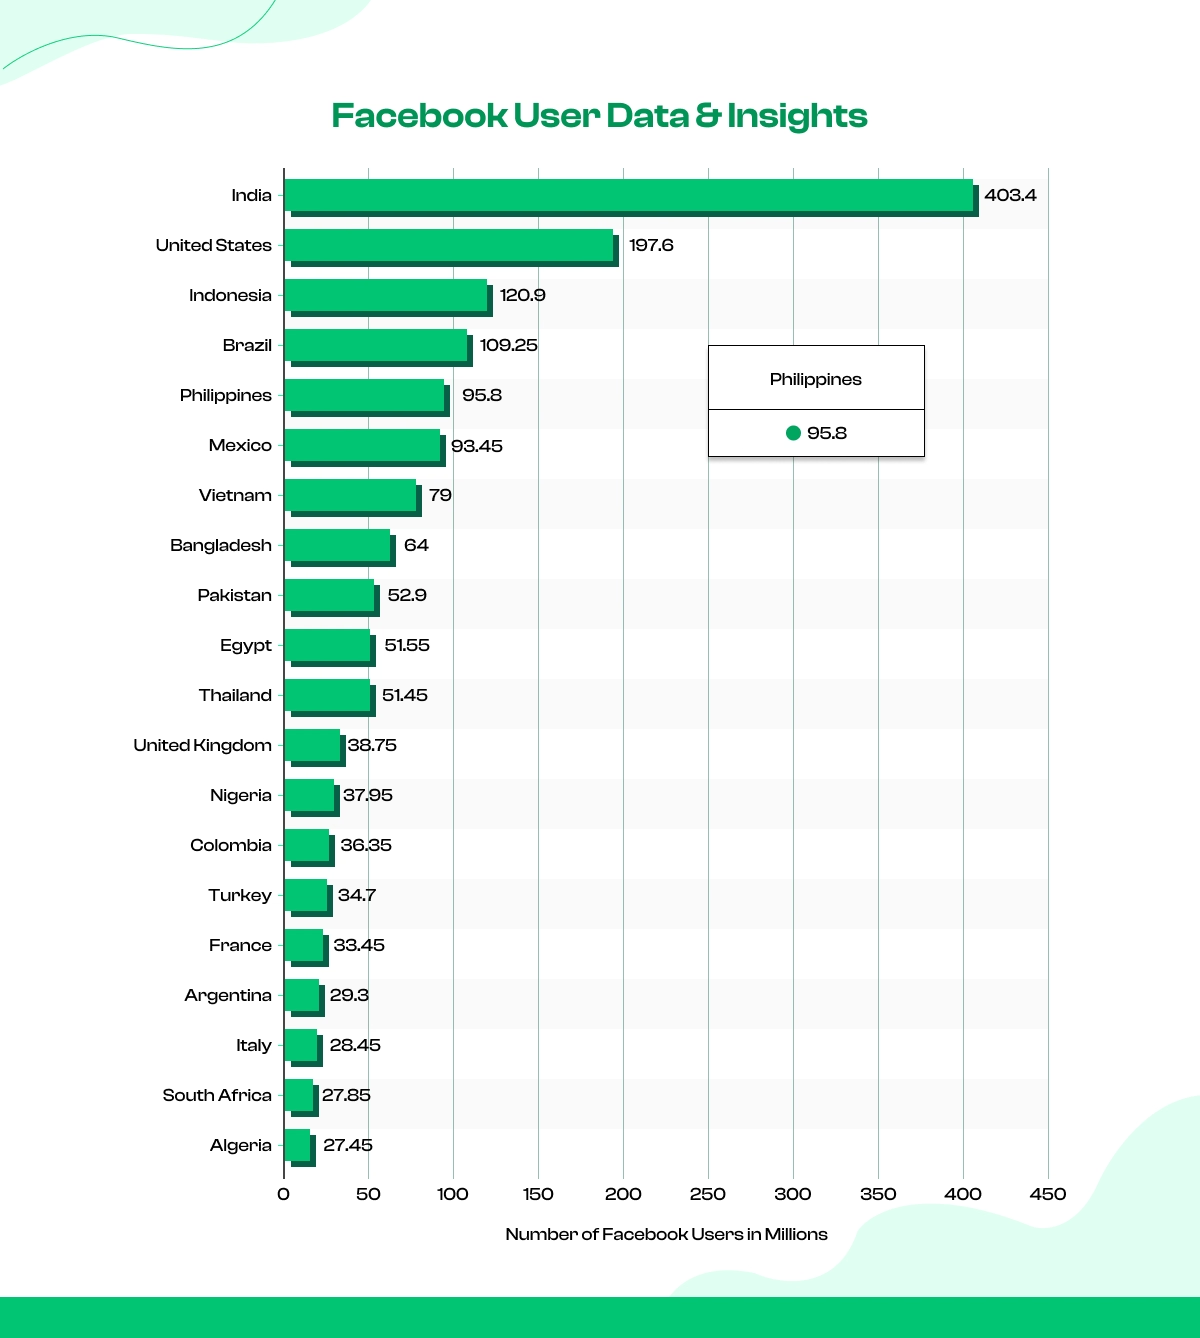
Facebook continues to hold the largest share of the global online population.
▶
60% of product research is conducted through social media, with TikTok being the most trusted platform for product discovery. [Source: Sprout Social]
The social media landscape has shifted toward AI-influenced branding. Regional markets are adapting, and forecasts offer important insights into this shift.
Total Number of Social Media Users Worldwide
Below is the breakdown of social media users by region, ranked from the largest user base to the smallest.
▶Daily Active Users: 122 million users remain active on a daily basis.
▶
The average daily story view count reaches 70 billion.
▶YoY growth: Reached over 11.5% in 2025 (driven by ads).
▶Core age groups: 18 to 44 years, with over 95% platform penetration in this group.
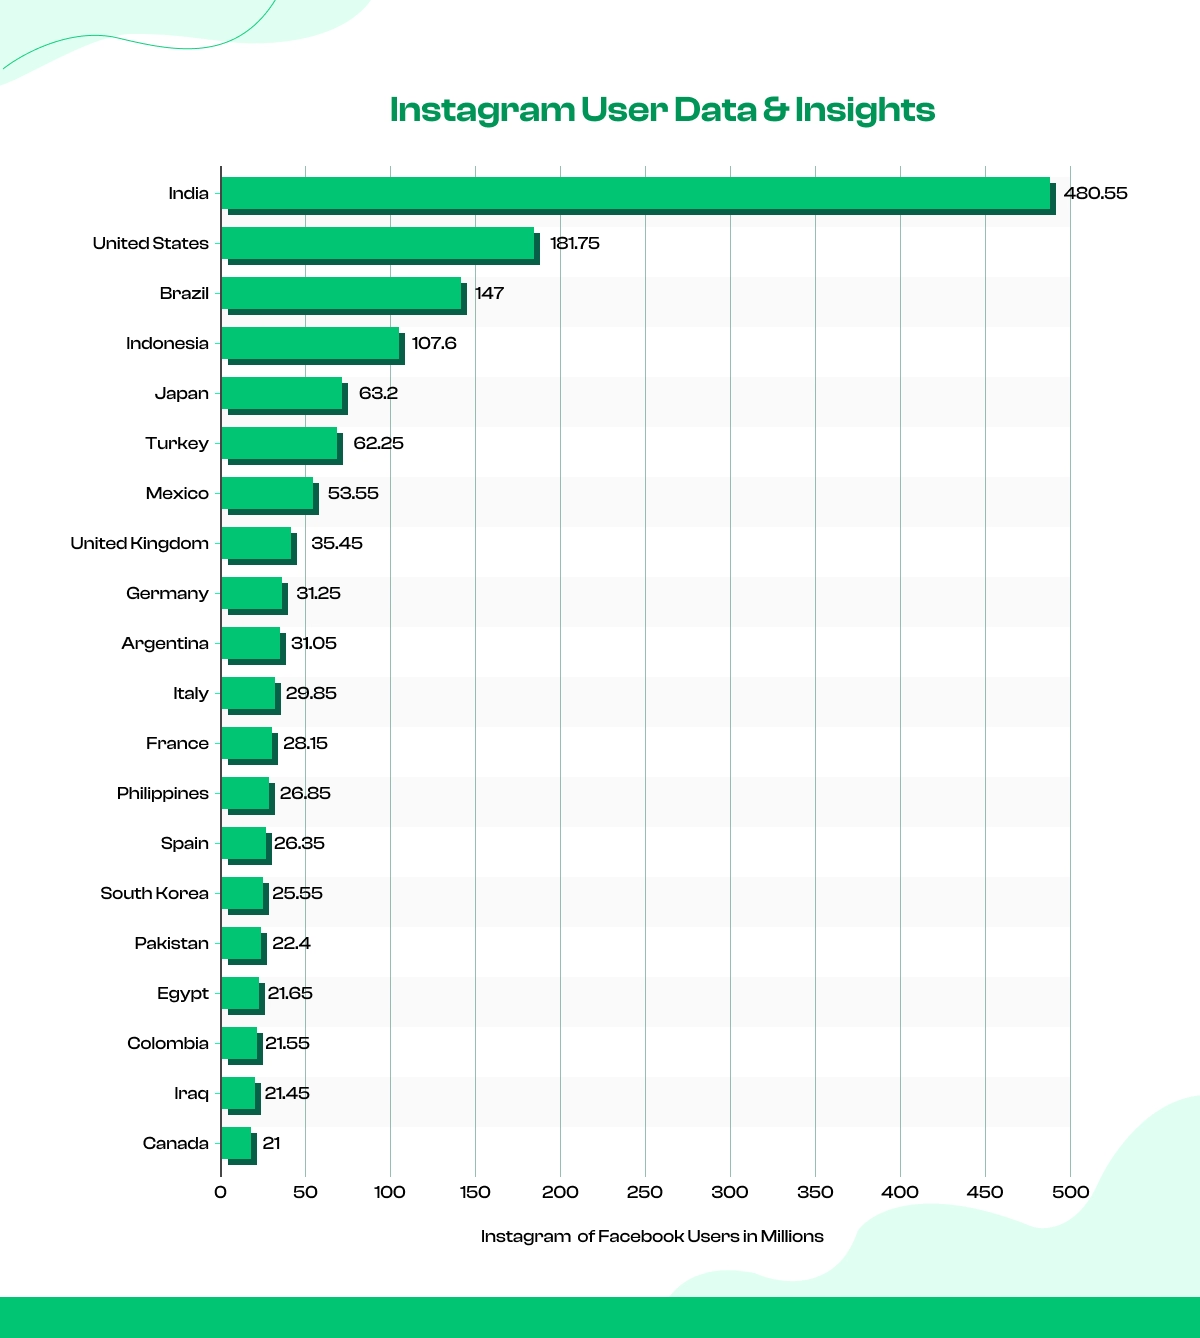
▶Top countries by users: India ranked 1st on the list (491 million users). The 2nd and 3rd ranks are held by the USA (253M) and Brazil (144M).
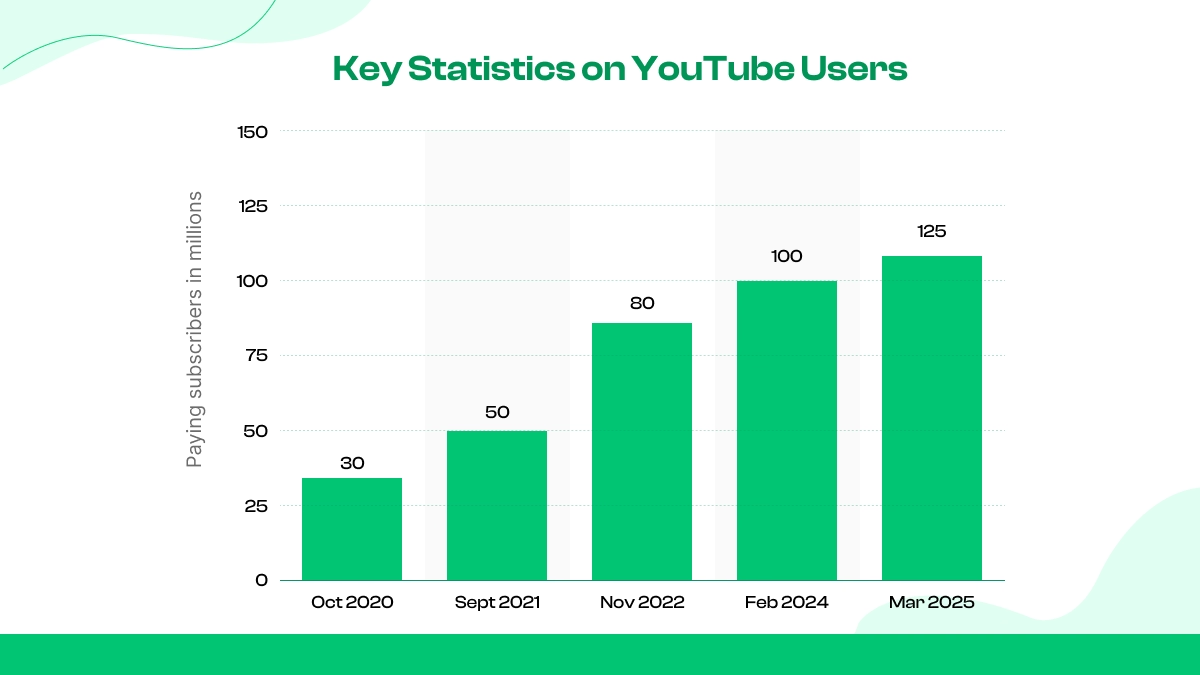
▶Net revenue: Combining ads and subscriptions, this video network generated over $60.4 billion in revenue in 2025.
▶Ad revenue: $36.1 billion of the net revenue came from ads.
▶Daily watch time (hours): Users spend at least 48 minutes on the site.
▶Top-Performing Content: Technology, education, & finance are the most competitive niches. Plus, the gaming & entertainment industry is traditionally saturated.
▶Market Penetration: Covers 30.9% of the world’s population and 45.5% of internet users.
▶YoY Growth: Net earnings grew by 11% according to the latest report.
▶Core Age Groups: Over 52% of net members' interactions come from the 25–34 age category.
▶Top Countries by Users: USA: 225 Million, India: 128 Million, Brazil: 72 Million
▶Net Revenue (FY 2025): The latest earnings release indicates an 11% year-over-year growth rate, driven by “premium subscriptions.”
▶Global Ad Revenue (FY 2025): The company’s financial releases confirmed the number of $7.4 billion, indicating its capability.
▶Average Daily Watch Time: It averages 7.5 minutes, driven mostly by niche-specific video content.
▶B2B usage indicators: 89% of B2B leaders use it as a lead generation channel.
▶Country-wise professionals: The following top five countries represent the highest professional users, which are located in the USA, India, Brazil, China, and the UK [Source: 99 firms]
▶Core Age Groups: The network involves ..members per month
▶Daily Active Users (DAU): 477 million individuals log in to this network per 24 hours.
▶YoY Growth: Year-over-year financial calculation suggests an increase of over 9.0% rate.
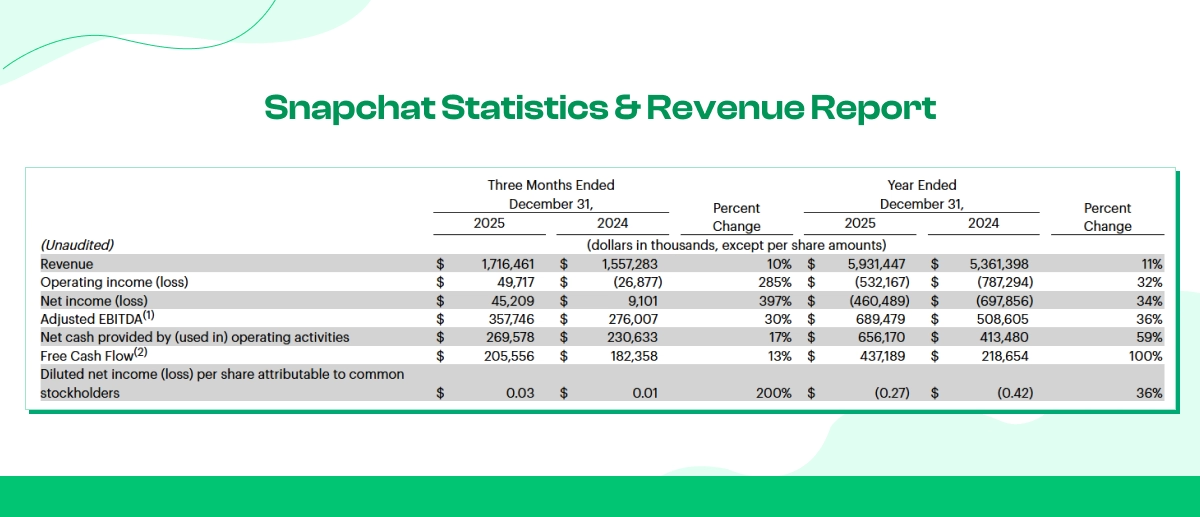
▶Top Countries by Users: India is the world's largest market of Snapchat (210 million–214 million users). The United States (105–106 million) & Pakistan (37-39 million) sit in the second and third positions, respectively.
▶Daily Active Users (DAU): The platform extended to 141.5 million people around the world.
▶YoY Growth: Data shows a 100% year-over-year increase during the 2025-2026 session.
▶Core Age Groups: The 18–24 age group is leading this network, capturing 31% of the audience base. [Source: Statista]
▶Top Countries by Users: India, Brazil, and the USA represent the largest three consumer markets.
▶Net Revenue (FY 2025): The revenue return was around 8 billion in 2025. For 2026, the revenue is projected to reach 11.3 billion by the year-end.
▶Global Ad Revenue (FY 2025): Market forecasts suggest the Meta revenue contribution may hit 11.3 billion. Advertisers will now be able to expand their Instagram and Facebook campaigns. [Source: business of Apps]
▶Average Daily Watch Time: The users spend 5 minutes on average on the platform. [Source: buffer]
▶Engagement size: Posts on Threads experience a 6.25% median engagement rate.
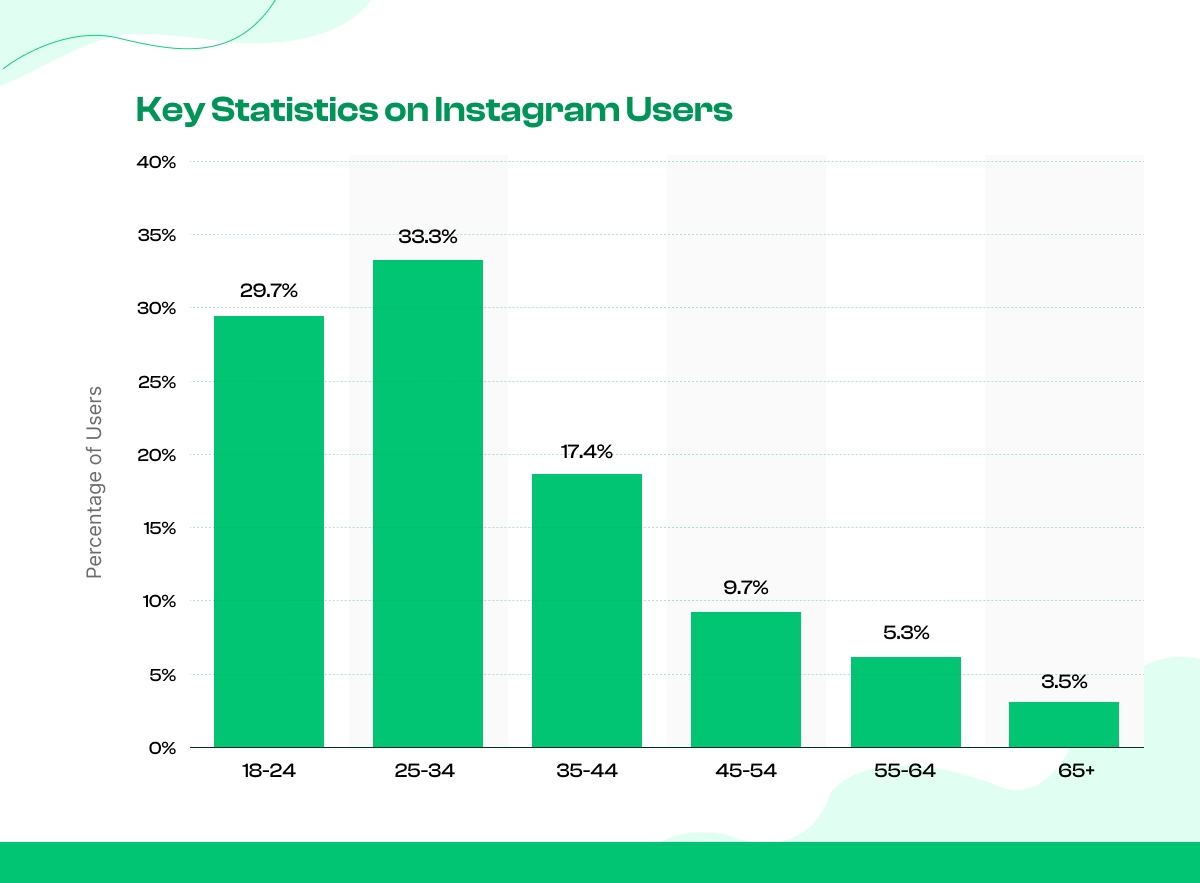
The age group says a lot about any social media platform. For targeted ad campaigns, understanding the user base is crucial to achieving marketing success.
Social Media Users by Age Group
Teens now prefer feeds built around interests rather than social connections. For the first time in history, a major portion of the teens (2/3) are avoiding Facebook. [Source: Pew Research Center]
TikTok is no longer just a Gen Z app; it has turned into a mainstream favorite. The 25–34 age group is the most contributing demographic behind its growth.
YouTube’s dual role as an entertainment channel and search engine is still appreciated mostly by boomers. 60% of users of this video network are over 65 years old.
China & India remain key global leaders as "billion-user" and "near-billion-user" markets. Brazil and the Philippines are the top countries with the highest time-spending user base. Surprisingly, Vietnam’s local communication network dominates over global giants like Meta.
Countries With the Highest Number of Social Media Users
The following table ranks countries by the number of users, including the ruling apps:
America remains the key player in social network coverage. Privacy, lifestyle app integration, and user behavior played key roles in different global regions.
North America
Drawing from the verified data of January 2026, the social media penetration rate reached 83%, indicating the most potential region for global branding. Among the other virtual social spaces, like Facebook, YouTube, and Instagram, capture the maximum user base. Primarily, mass-level smartphone reach contributed to this success.
Europe
This region boasts an 81.4% social media penetration rate. Among the other major social media platforms, WhatsApp, Facebook, and Instagram are dominating across this region.
Meanwhile, Telegram is gaining mass popularity due to its superior privacy features. BeReal's niche focus on authenticity made it popular among users in this region.
Asia-Pacific
The eastern part of this region displays a 76% penetration rate, whereas the southern side exhibits a 33.4% rate.
Dominant Platforms: WeChat (key communication app in China), YouTube, WhatsApp (India/SE Asia), and TikTok. With 874M users, India has become the world's largest social market.
WeChat pioneered super apps, which are redefining digital life by integrating payment services. They are enabling users to handle messaging, transactions, bookings, and more without leaving the platform.
Latin America
Latin America’s 74.0% penetration rate is mostly bolstered by mobile-first adoption. WhatsApp tops major platforms like Facebook and Instagram due to its strategic "default OS" advantage. The new video-centric social network Kwai emerged as a hard competitor to TikTok. [Source: Smartling]
Africa
Unlike its Central zone, which holds only 17.0%, social networks penetrated 45.0% of Africa's Southern territory. The expanding internet infrastructure consistently influences users to engage, which has turned into a massive success in Nigeria. The country has the world's highest "brand research" usage on social media (86.2%). [Source: Wix ]
Social Media Engagement Statistics
The benchmarks indicate a steady engagement rate of 1.8% (approx.) across social media spaces. TikTok and Instagram are driving the major portion of it, mostly driven by short-form videos.
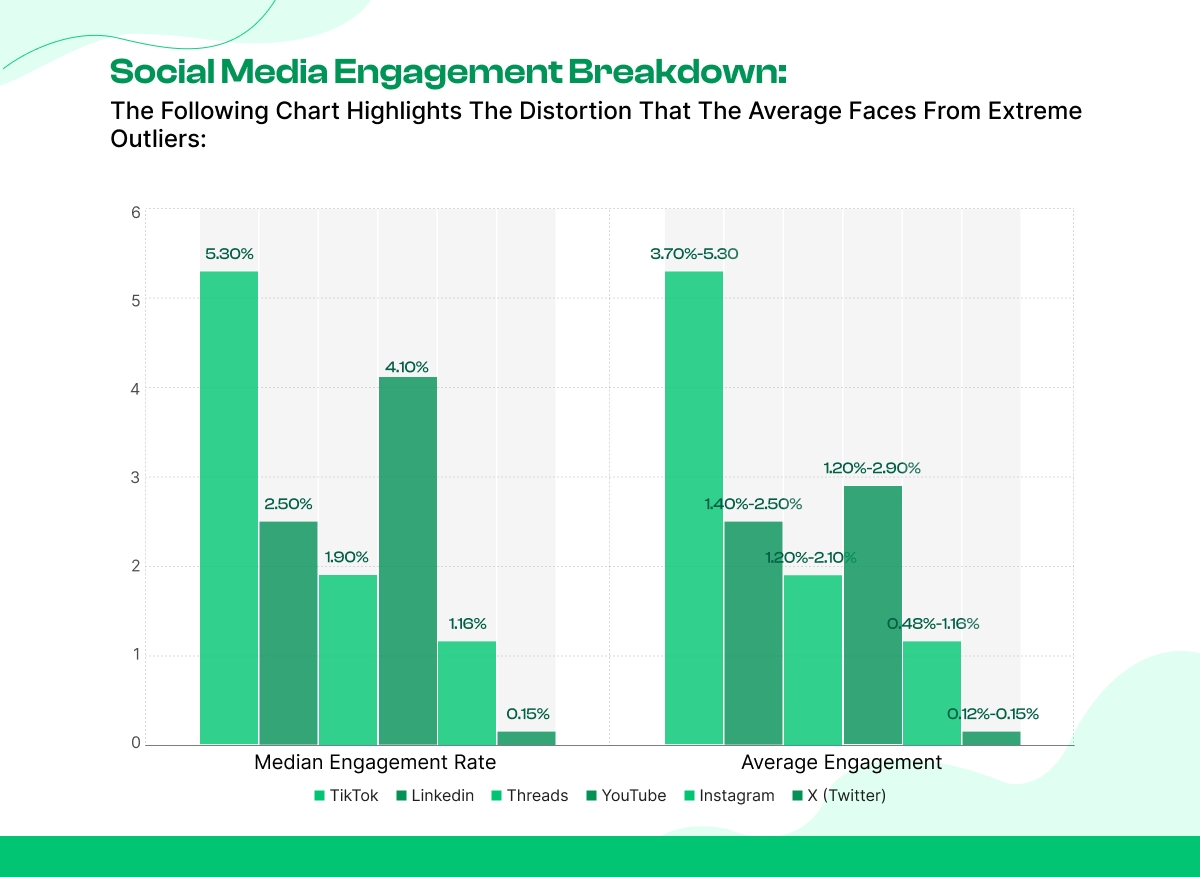
Average Engagement Rate by Platform
TikTok, LinkedIn & Threads are holding the top three positions in terms of engagement rate.
The following table highlights the distortion that the average faces from extreme outliers:
▶
According to the available ad campaign analysis, video generated 80% more conversions than other formats. [Source: Social Media Today]
▶
Images usually earn engagement rates between 1% and 3.5%. [Source: Adobe]
▶
In the 2025–2026 benchmarks, the overall average engagement rate for posts (short and long form) sits between 1% and 3%. [Source: Ok To Post]
Across all social media forums, the average video content engagement rate typically ranges between 1% and 5%. Remarkably, short-form videos often see an engagement spike (approximately from 2.5% to 4.86%).
Social Media Advertising Statistics
The social media ad market is growing consistently, with a 10.4% year-over-year growth rate. For marketers, creators, and promoters, they are a reliable lead generation channel.
Expert analysts suggest the ad expenditure may reach $317.33 billion in 2026.
Global Social Media Advertising Revenue
▶
Considering the overall market, global social media ad spending may reach $317 billion USD.
▶
On the other hand, marketing experts project that the global ad revenue growth rate could range from 10.9% to 18.1%.
Ad Reach by Platform
Based on key market statistics, Facebook and YouTube both occupy the top two positions. Meanwhile, WhatsApp’s year-over-year performance surge pushed it to the third-most-ad-reach giant status.
▶TikTok: For 2026, analysts suggest the ad revenue may cross $20 billion. [Source: newmedia]
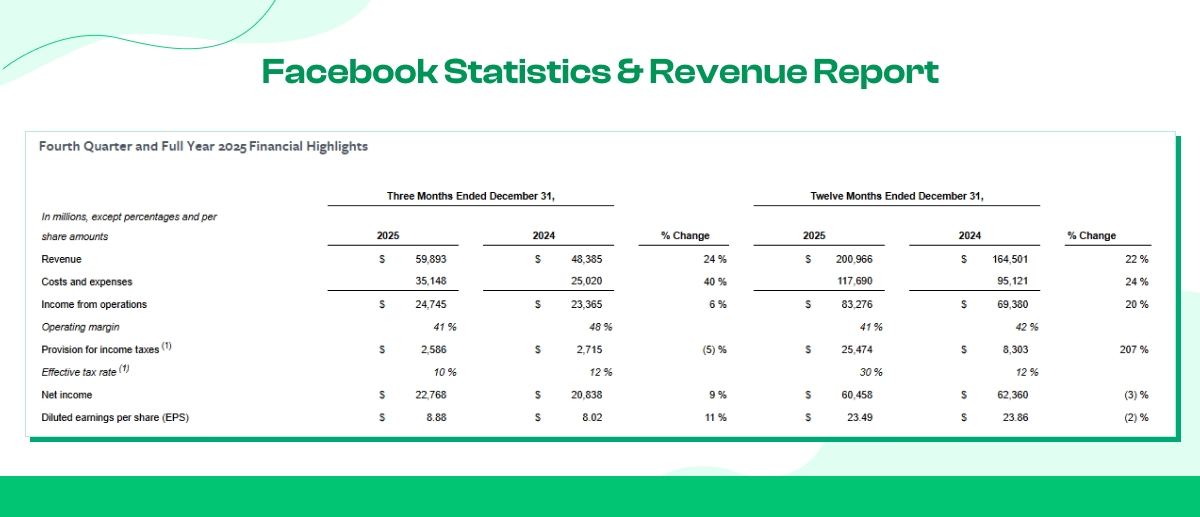
▶Facebook: By the end of 2026, annual ad revenue is expected to exceed $200 billion. [Source: Insidea]
▶Instagram: Early market forecasts suggest Insta’s ad revenue may hit $42.52 billion. [Source: Resourcera, ]
▶LinkedIn: By the end of 2026, the annual growth rate of ad revenue may hit 18.5%. The platform’s ad revenue is projected to surpass $9.7 billion this year, mostly driven by B2B demand. [Source: martal.ca]
▶
X (formerly known as Twitter): Market forecasts suggest the revenue may hit $2.99 billion in 2026. [Source: The Frank Agency]
▶YouTube: YouTube is poised for $60 billion in ad-driven revenue in 2026. [Source: Business Of Apps]
▶Snapchat: Its ad-driven revenue is anticipated to reach approximately $5.5 billion. This may exceed $5.7 billion. The annual growth rate may hover between 10% and 12% [Source: snap.com, Morningstar analysis]
▶Reddit: If the platform can maintain its previous growth trajectory, market analysts expect the annual ad revenue to range from $3.1 to $3.3 billion. [Source: Seeking Alpha]
▶Twitch: The 2026 market projection shows an expected range from $850 million to $1.1 billion. [Source: Socialplug]
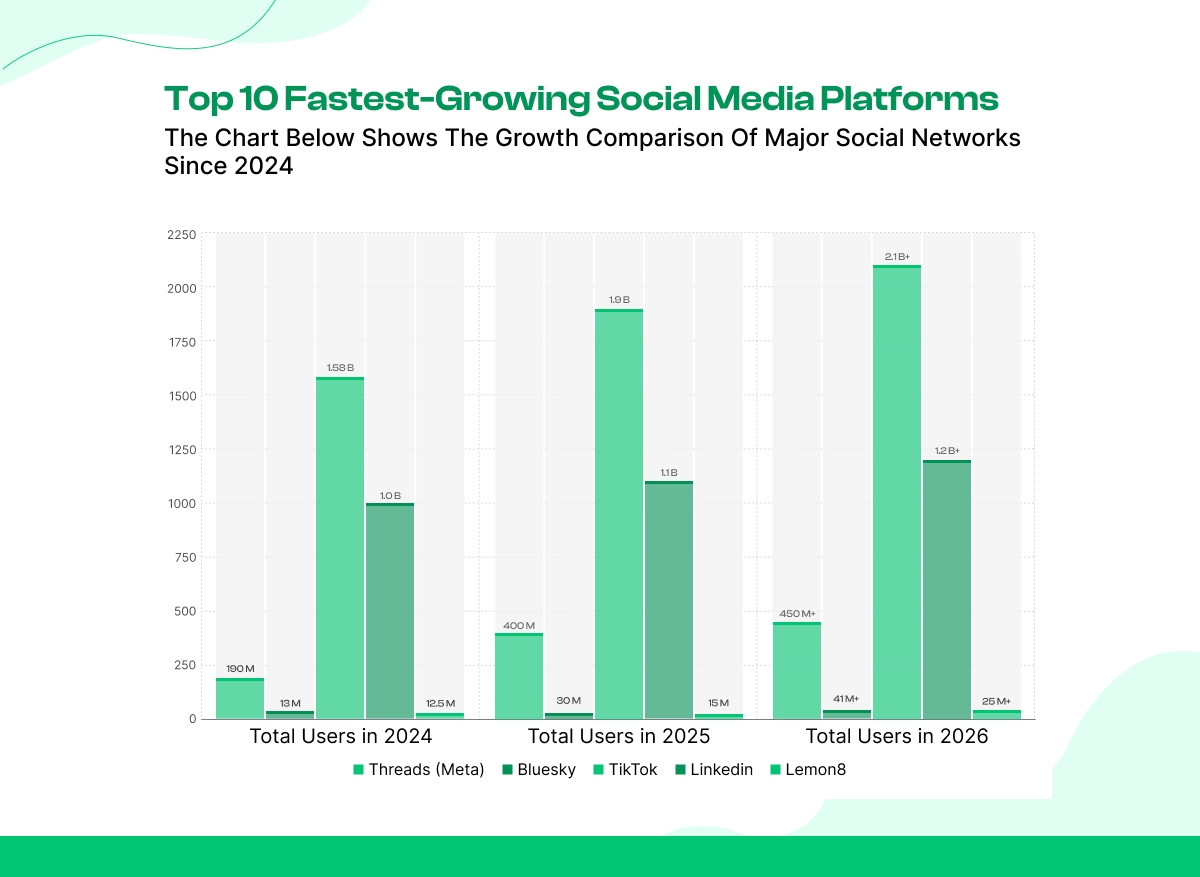
Growth reports provide the most reliable insights on which platforms are getting netizens’ attention. Here are the top of the list:
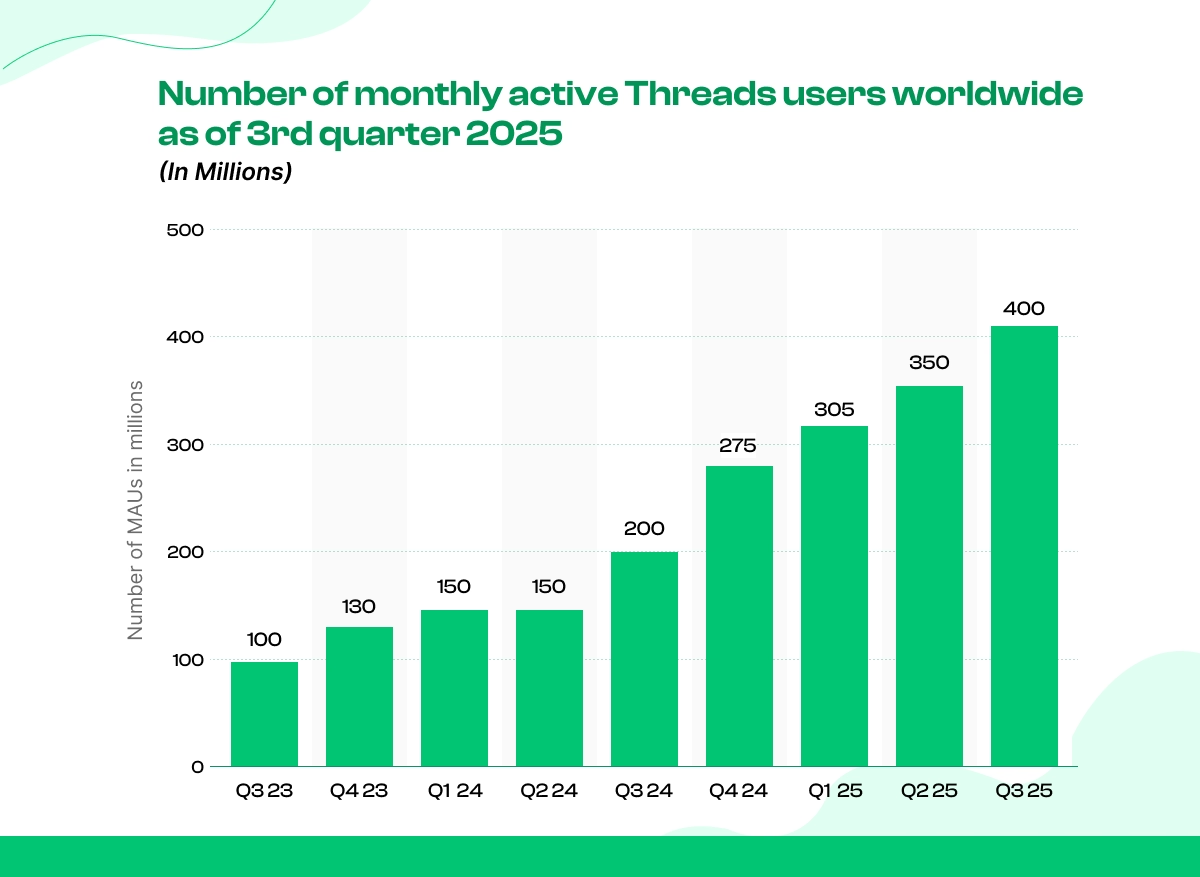
▶Threads: Currently, this platform has 100 million daily active users. As of early 2026, it is displaying an unprecedented growth trajectory with a 127% year-on-year increase. [Source: Agorapulse, Resourcera]
▶Lemon8: It was launched in 2020 and is owned by ByteDance. It has experienced a surge, propelled by 46% of Gen Z users. It is boasting a staggering 3% year-over-year growth by early 2026.
▶RedNote: During the early 2025 TikTok shifts, it was downloaded 3.7 million times. The platform reached its peak, with 200% yearly growth that year. As of February 2026, it exhibits a 16.67% YOY growth.
▶Bluesky: The platform alone is currently 2.8% of all global social media posts. It reached 42 million users in 2026. Analyzing all the available data from 2025 to early 2026, it achieved a roughly 1.42% Y-O-Y increase.
▶
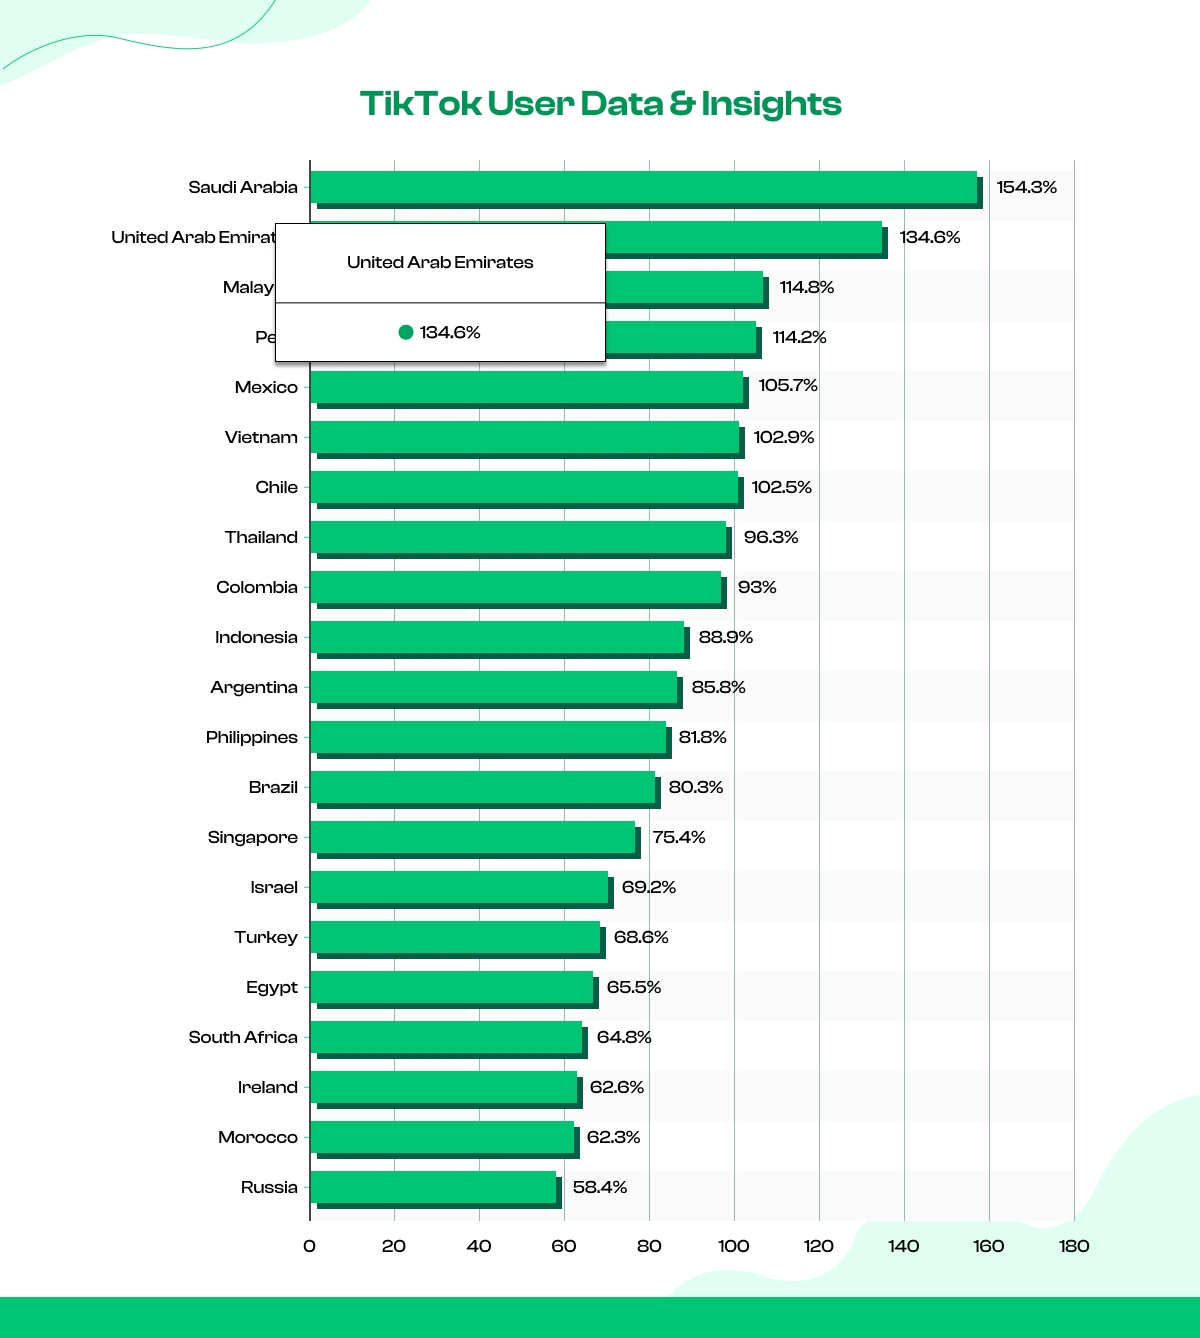
TikTok: TikTok’s year-over-year audience growth increased by 17.6% in 2026.
▶LinkedIn: Evidenced by a 127% year-on-year rise, it now possesses 1 billion members. The growth is largely driven by the Asia Pacific’s professional lifestyle content.
▶Telegram: This platform excels in growth and user count compared to the old giants. In 2026, it is now experiencing an impressive over 5.26% year-over-year jump backed by 1 billion users.
Social Media Behavior Statistics
Most social media have now emerged as a competitor to Google! The latest Forbes magazine report states that 24% of users now prefer social media over this veteran search engine.
Top Reasons People Use Social Media
Here are the key drivers behind this shift:
▶
50.8% of users use them to keep in touch with friends and family.
▶
39% of users appreciate social media as their entertainment channel during their free time.
▶
Information & news discovery ranked 3rd in the mass priority list.
▶
For 30.5% of users, they are useful to find niche-based videos & articles.
▶
The latest trends are the key reason for 29.2% of users. [DemandSage]
▶
Approximately 38.3% of internet users prefer it for professional purposes.
▶
61% of Instagram users value the platform for early product updates and say it helps them research those products. [Source: Sprout Social]
27.3% of people, mostly the young generation, use it for their product research. They use it to learn, analyze, and make decisions before purchasing. Aesthetic-centric/inspirational content seems to play an essential role for 27.2% of total users.
For 23.6% of users, social media is a great medium to stay updated on sports news.
The platforms are shifting faster than most brands can keep up with. Threads is closing in on X. TikTok's engagement still outpaces every legacy platform. LinkedIn is quietly becoming a video-first network.
These social media platforms statistics make one thing clear: strategies built on last year's assumptions are already outdated. Winning in 2026 means matching your content, budget, and platform choice to where your specific audience actually is, not where it used to be.
Socialplug builds strategies around exactly this kind of shift. If you want a plan grounded in current data instead of guesswork, that is where we come in.
If you want to grow your business and maximize the revenues, check Socialplug’s services today!
Great tips! I never realized how much engagement impacts growth more than just posting frequently. I've been focusing only on content, but now I see how interacting with my audience can make a difference. Time to step up my strategy!
NF
Nicholas Feyenoord
Super helpful article! I always thought Facebook Groups were just for discussions and never really considered them as a tool for growing followers. The idea of actively engaging and sharing valuable content in relevant groups makes so much sense. I'll definitely start participating more and see how it impacts my page. Thanks for the great advice!
Danke! Deine Einreichung ist eingegangen!
Hoppla! Beim Absenden des Formulars ist etwas schief gelaufen.












0 Comments
Great tips! I never realized how much engagement impacts growth more than just posting frequently. I've been focusing only on content, but now I see how interacting with my audience can make a difference. Time to step up my strategy!
Super helpful article! I always thought Facebook Groups were just for discussions and never really considered them as a tool for growing followers. The idea of actively engaging and sharing valuable content in relevant groups makes so much sense. I'll definitely start participating more and see how it impacts my page. Thanks for the great advice!