









Understanding video marketing statistics is crucial for success today. Almost every company posts online videos now. Running a strategy without accurate data leads to bad choices and increases risk factors.
You might need to ask your team for a bigger video budget. You might want to see if your current view counts are good. You might need reliable facts for a report instead of simple guesses. This article handles all of these needs. Every data point below comes directly from a real source with an exact date.
Old marketing numbers get copied online for years after they lose value. We traced every statistic back to its first source before adding it here. When two top studies disagree, we show both numbers so you can see the full truth.
Key Video Marketing Statistics at a Glance
Source: Wyzowl 2026 Video Marketing Statistics
Quick Reference: Full Video Marketing Statistics Summary Table
Video Marketing Adoption and Usage Statistics
These video marketing stats start with adoption: 91% of businesses use video marketing in 2026, a figure from Wyzowl's twelfth annual survey of 266 people in late 2025. This 91% score ties the all-time high for the report. It comes right after a small decline in 2025.
Usage stats only tell part of the story, a pattern also visible in HubSpot's own video marketing data. The same study shows that 93% of video marketers call video an important part of their main marketing strategy. That number dropped a little from last year. Still, it remains a huge majority.
Reasons Companies Avoid Video
Not having enough time comes next at 19%. Our guide on YouTube promotion shows that's not always true.
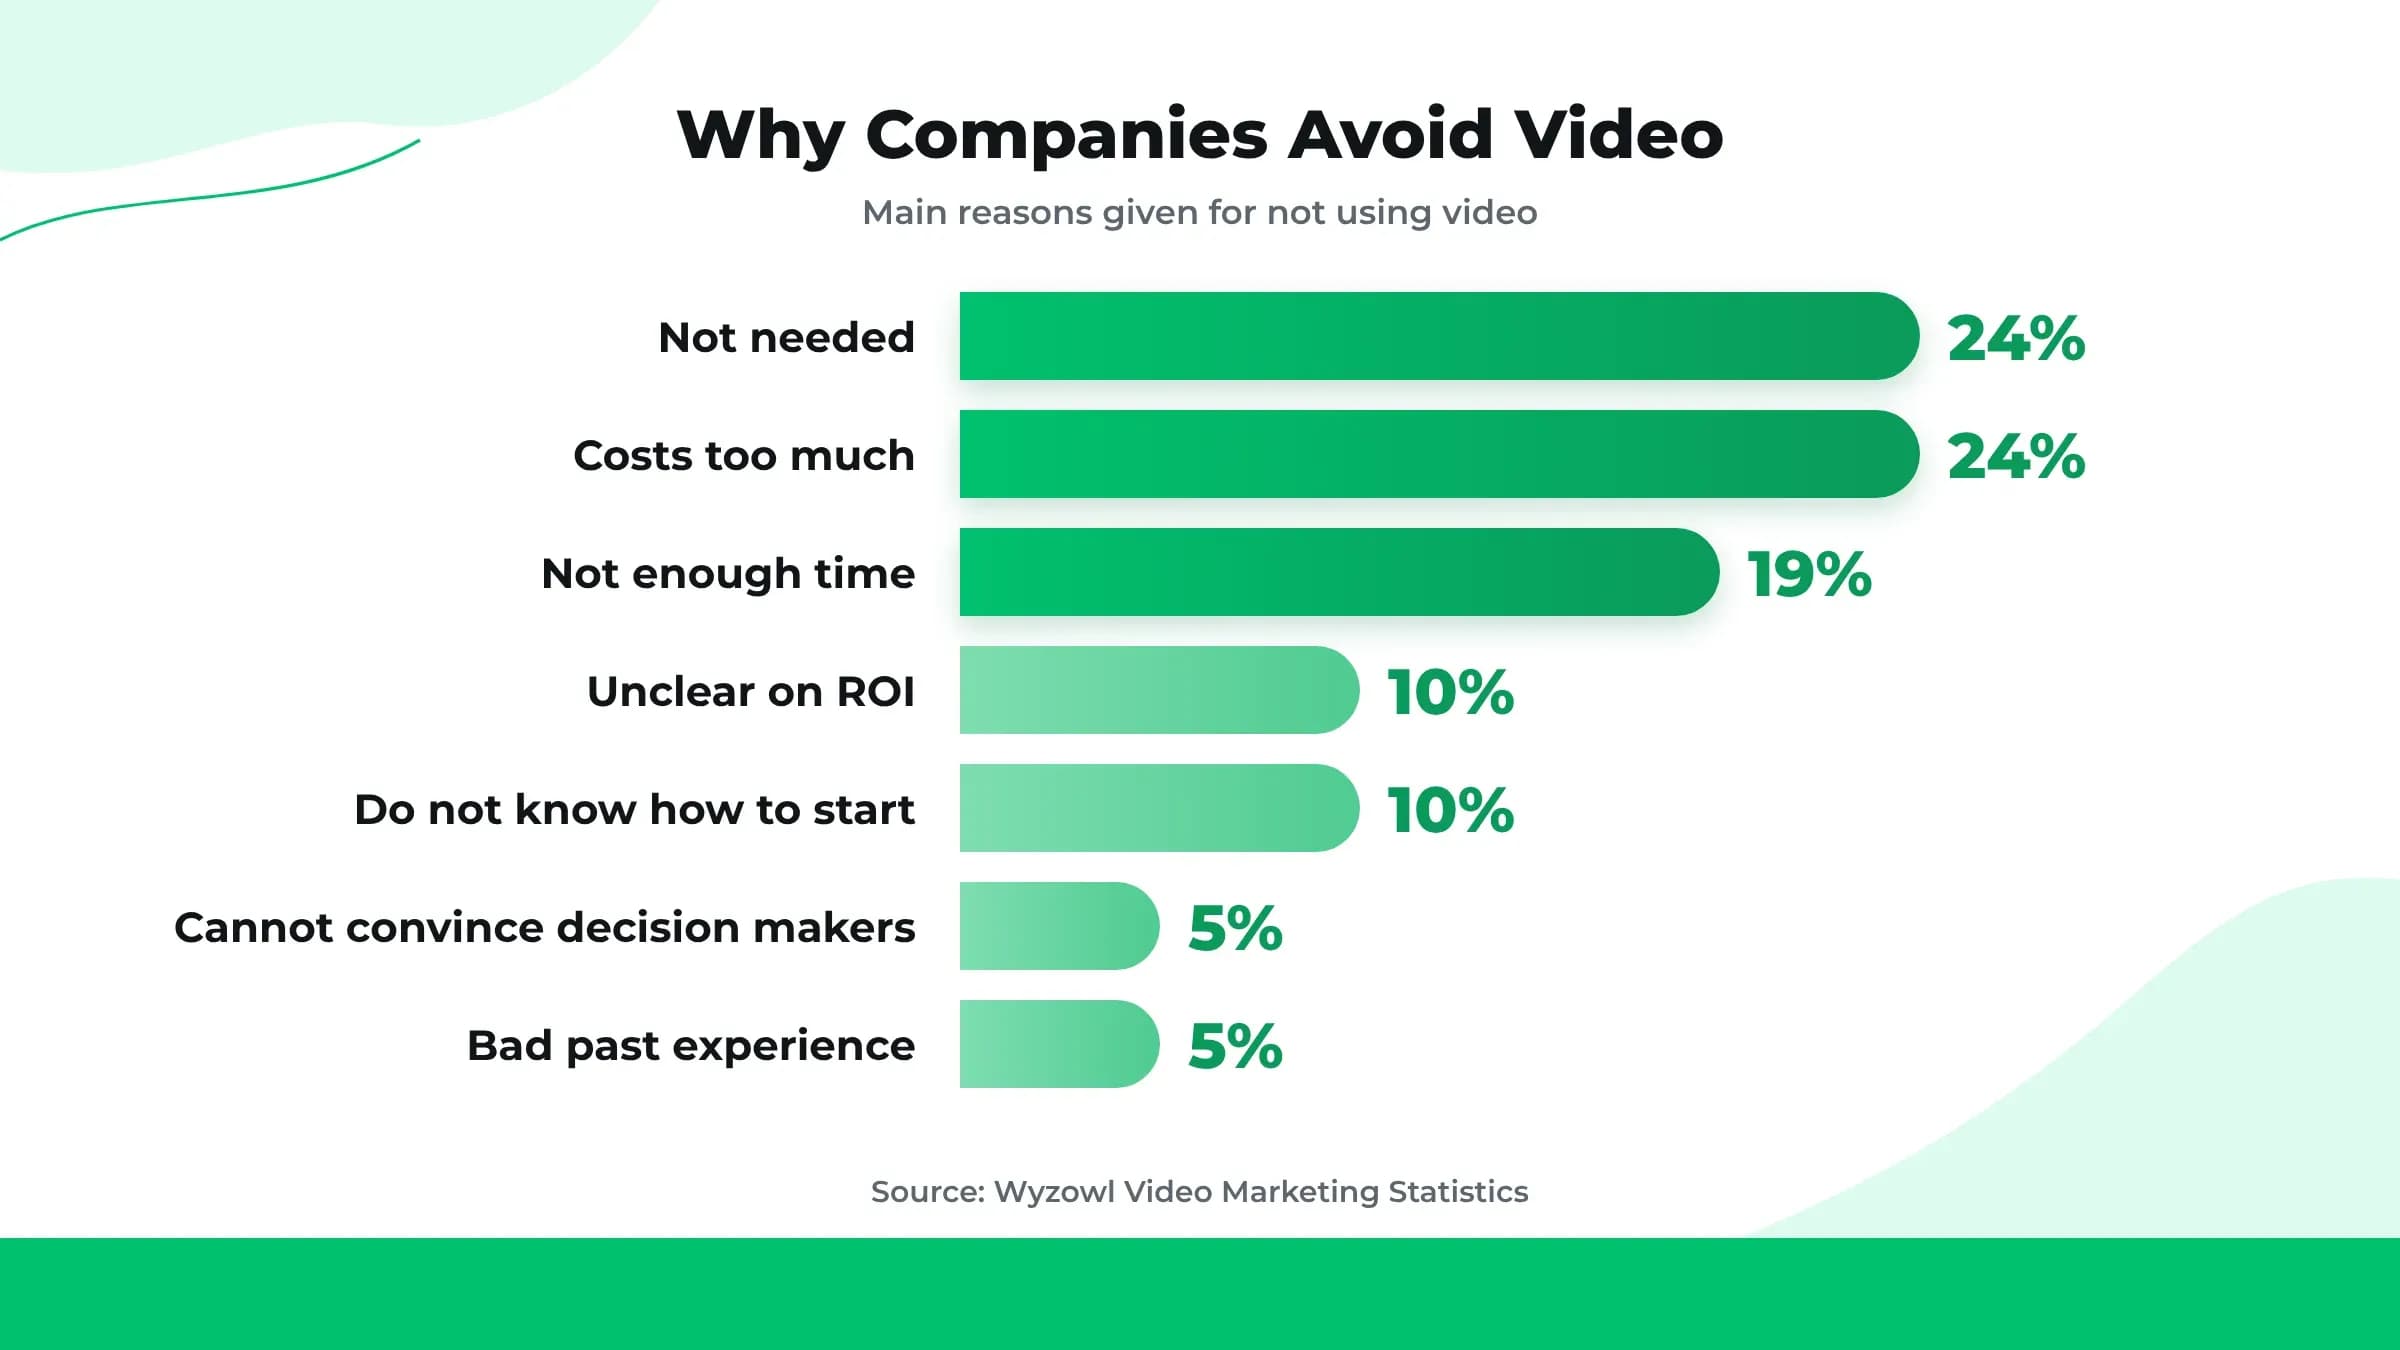
These problems do not stop companies from looking ahead. 67% of marketers who skip video right now plan to start in 2026. This is a 1% drop from last year. Even so, most holdout companies plan to take action soon.
Video Marketing Budget and Spend Statistics
Most marketers keep video spending at a modest level. Earlier mentioned reports show that 46% of marketers give 1/3 of their total marketing budget or less to video.
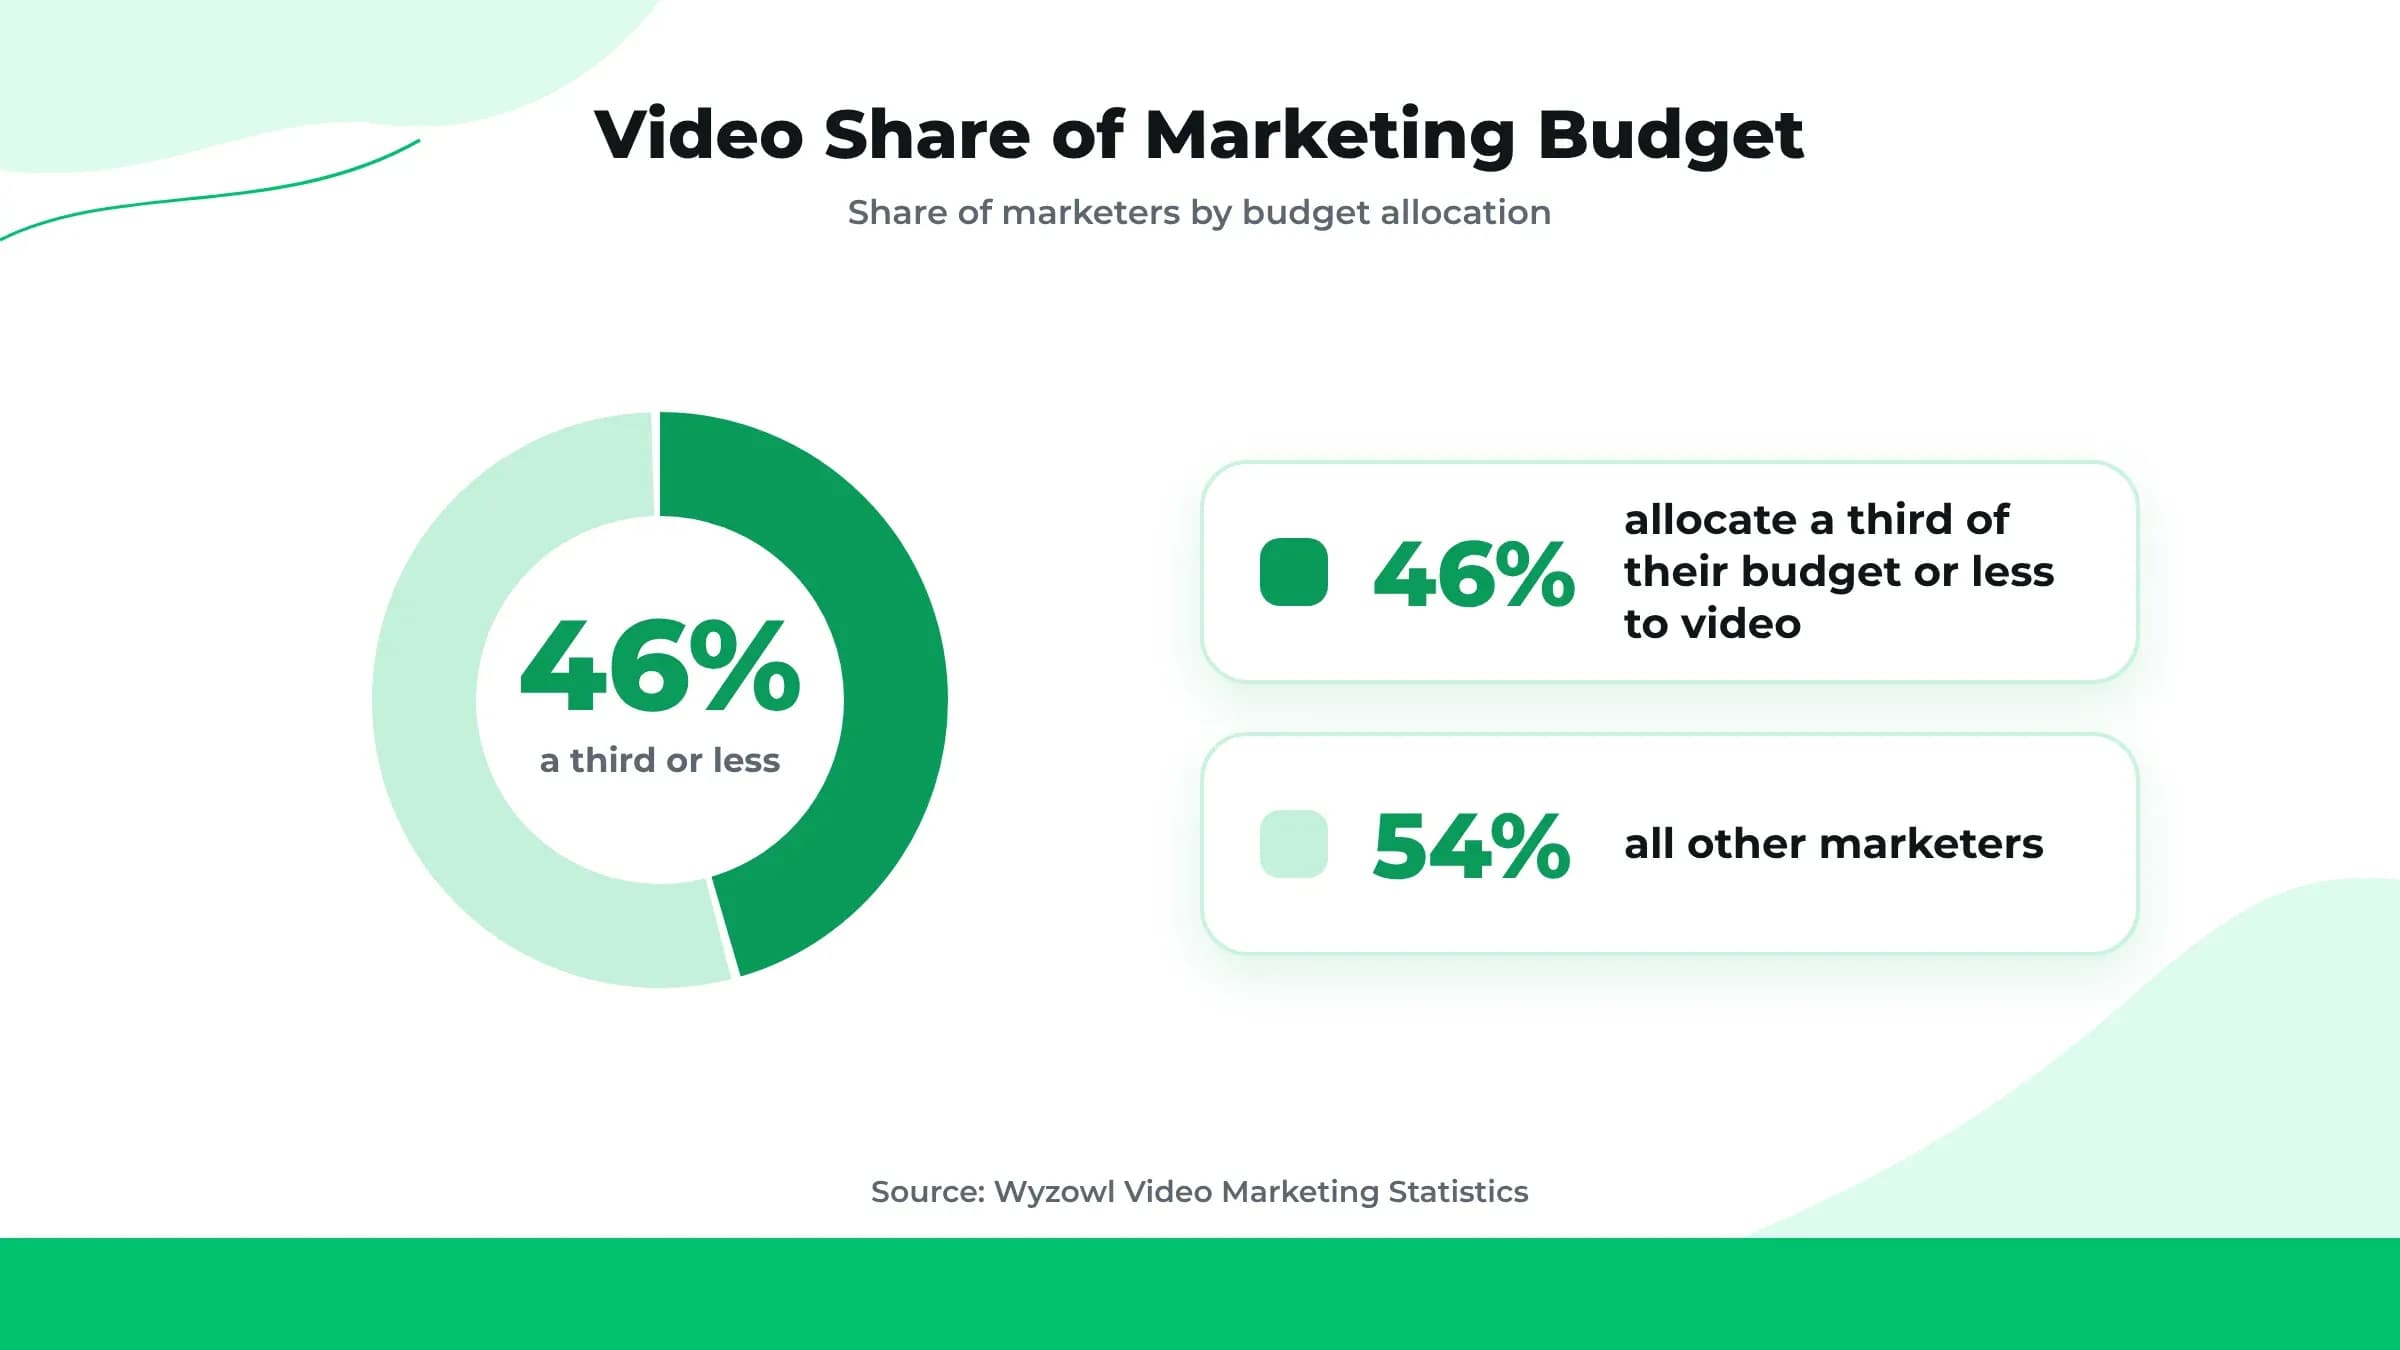
One key number needs extra attention. Industry surveys show that 17% of marketers do not track video spending at all. They do not know how much money they spend on video. Reports flag this as a major issue. A company that does not know its spending cannot judge if video gives a good return.
Spending plans lean strongly positive for the future. Industry reports show that 92% of marketers plan to spend the same or more on video in 2026. According to Wistia’s 2026 State of Video Report, 49% marketers are planning to increase video budget.
Paid Ads and Production Costs
Paid video is becoming a top choice. Earlier mentioned reports show that 41% of marketers spent money on video ads this year. That grew from 36% the year before.
These individual budgets exist within a huge market. According to the IAB Internet Advertising Revenue Report for full year 2025, produced with PwC, U.S. digital video ad revenue hit $78.0 billion in 2025. That includes connected TV, social video, and online video together. This total rose 25.4% year over year.
That was one of the fastest growth rates across all digital ad types in the report. This rapid growth shows why marketers expand video budgets even while views on production costs stay split.
Video Marketing ROI Statistics
The video marketing ROI statistics tell a clear story here: 82% of marketers say video marketing gives them a good return on investment. That marks a real drop from the previous year's record high of 93%. Still, 82% remains a strong majority.
This figure represents a self-reported opinion, similar to how HubSpot's Video Marketing Report frames its own ROI findings. Marketers are sharing what they believe about their results. It is not an audited financial record. Both types of data have value, but they are not the same thing.
How Marketers Measure Video Success
Recent surveys asked marketers how they measure that return. Their answers spread across several different methods:
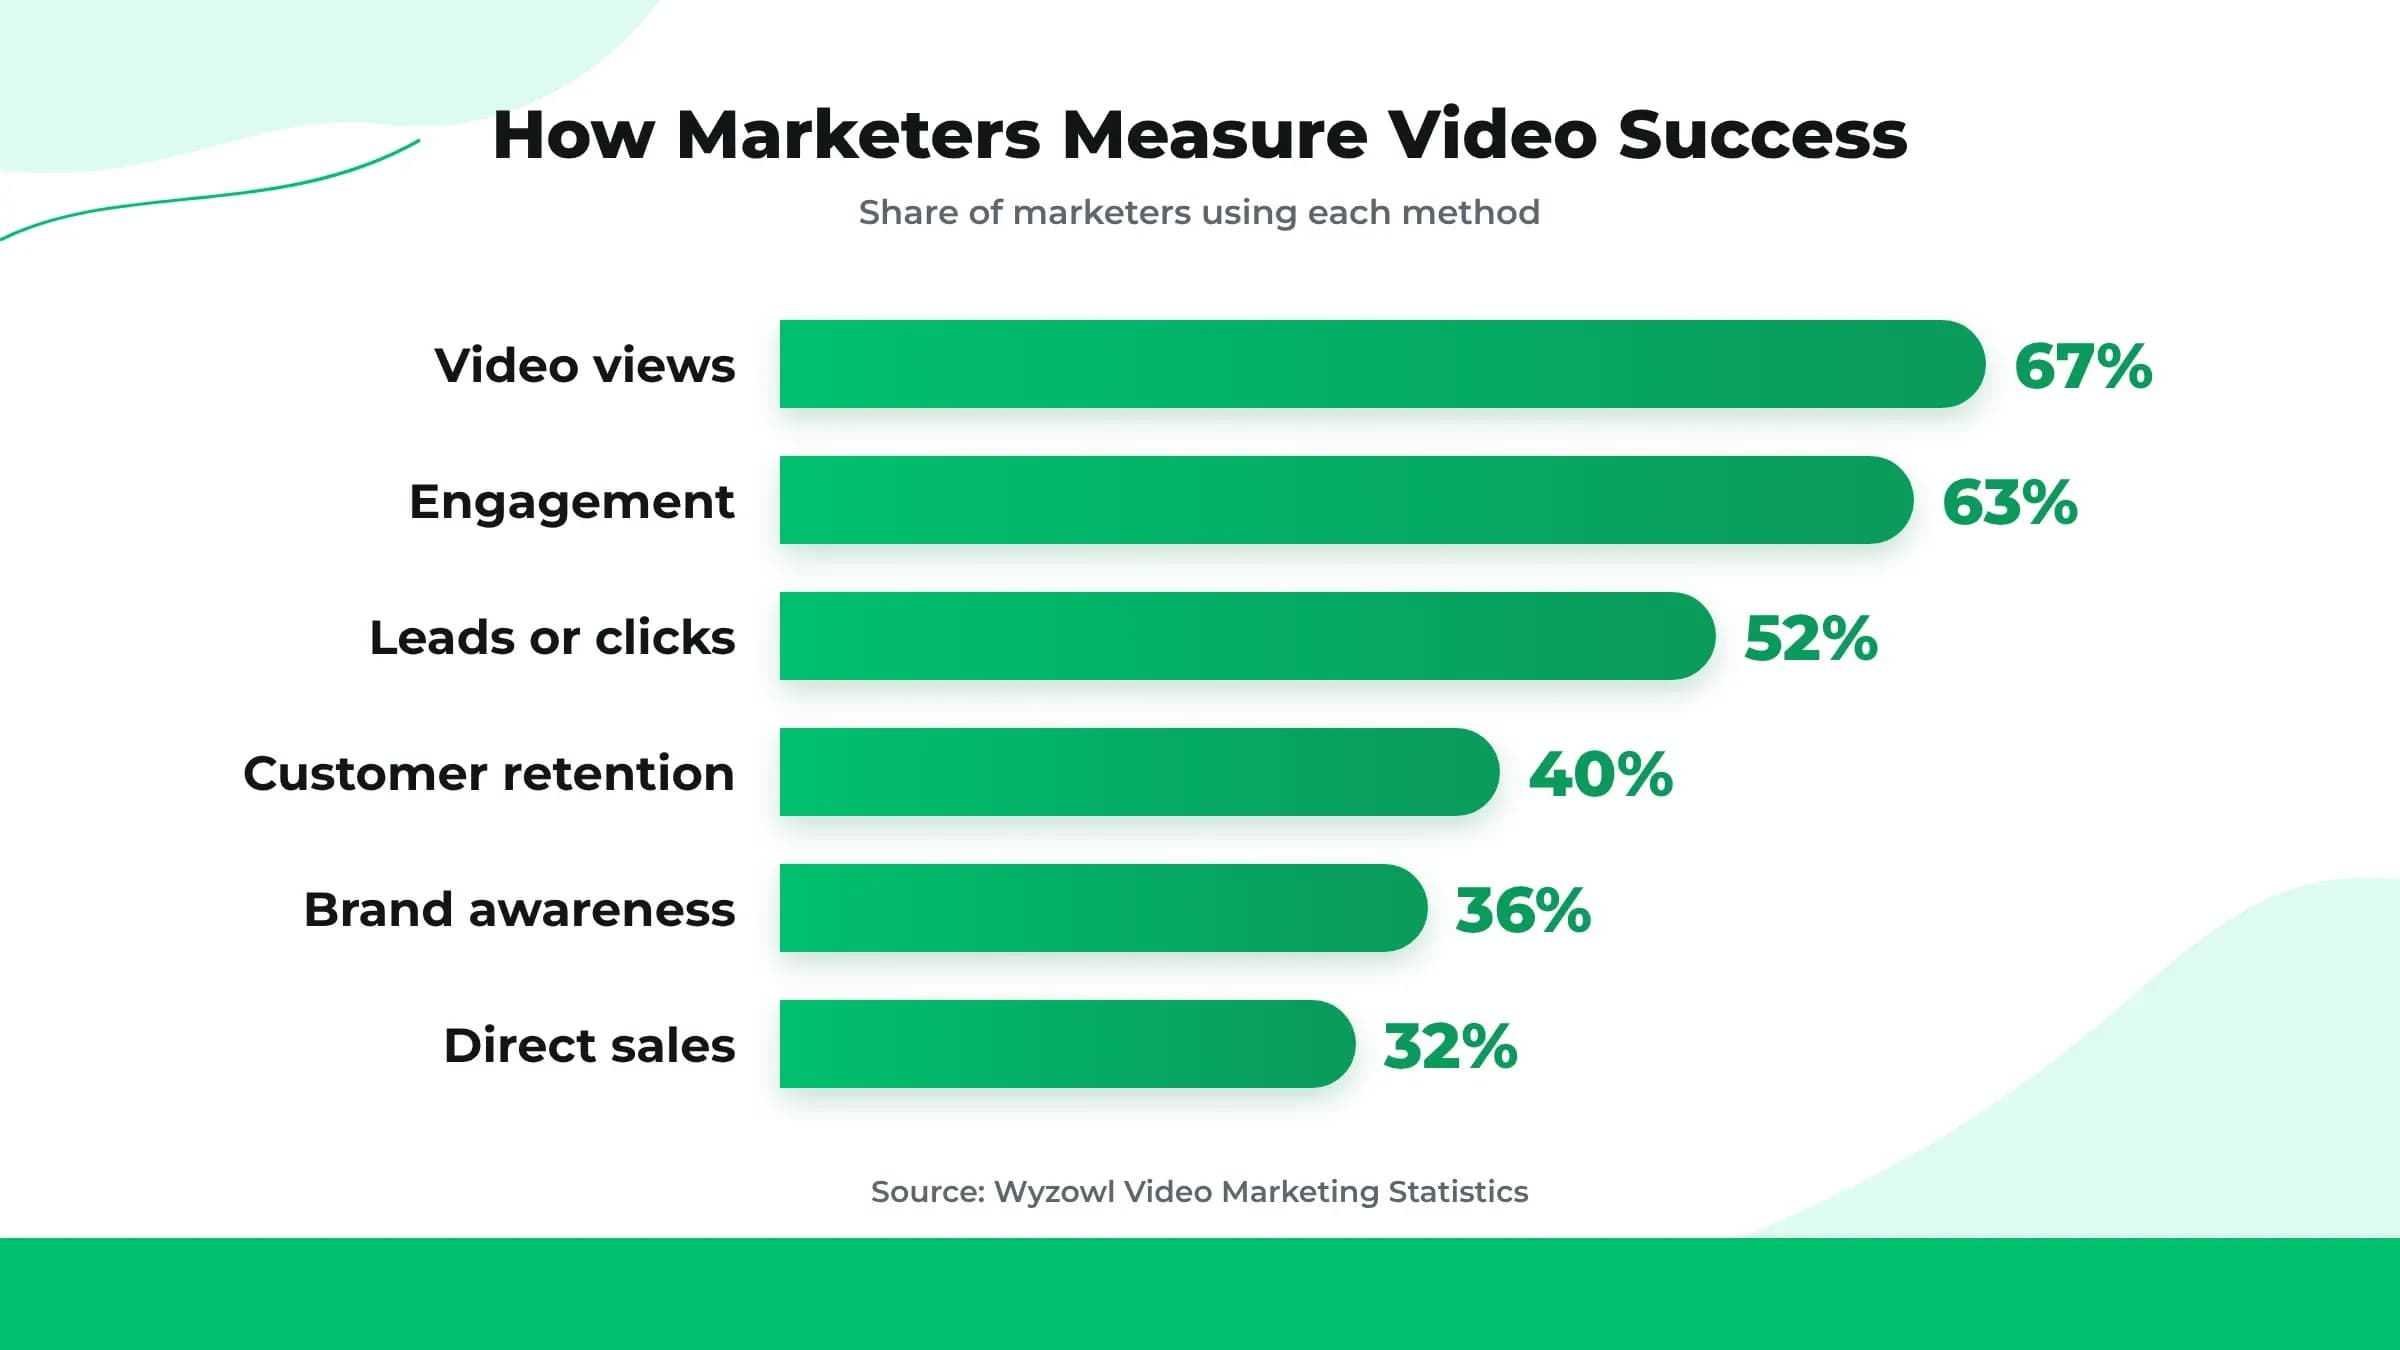
Notice the big gap between the top and bottom of that list, a pattern we cover in how YouTubers get paid for likes. Views are easy to count. More than twice as many marketers count views compared to direct sales. Direct sales are the hardest to track back to one video. Most marketers rely on simple signals like views and likes instead of direct sales numbers.
Specific Business Results
These wide ranging results prove that video brings clear value to almost every part of a business. So, considering working toward YouTube's monetization threshold? Buy YouTube watch hours from SocialPlug today, and get monetized in no time.
Video Content Consumption Statistics
These video content statistics show consumers interact with online video very often. 96% of buyers watched an explainer video to get information about a product or service. This finding stays steady across many years of research.
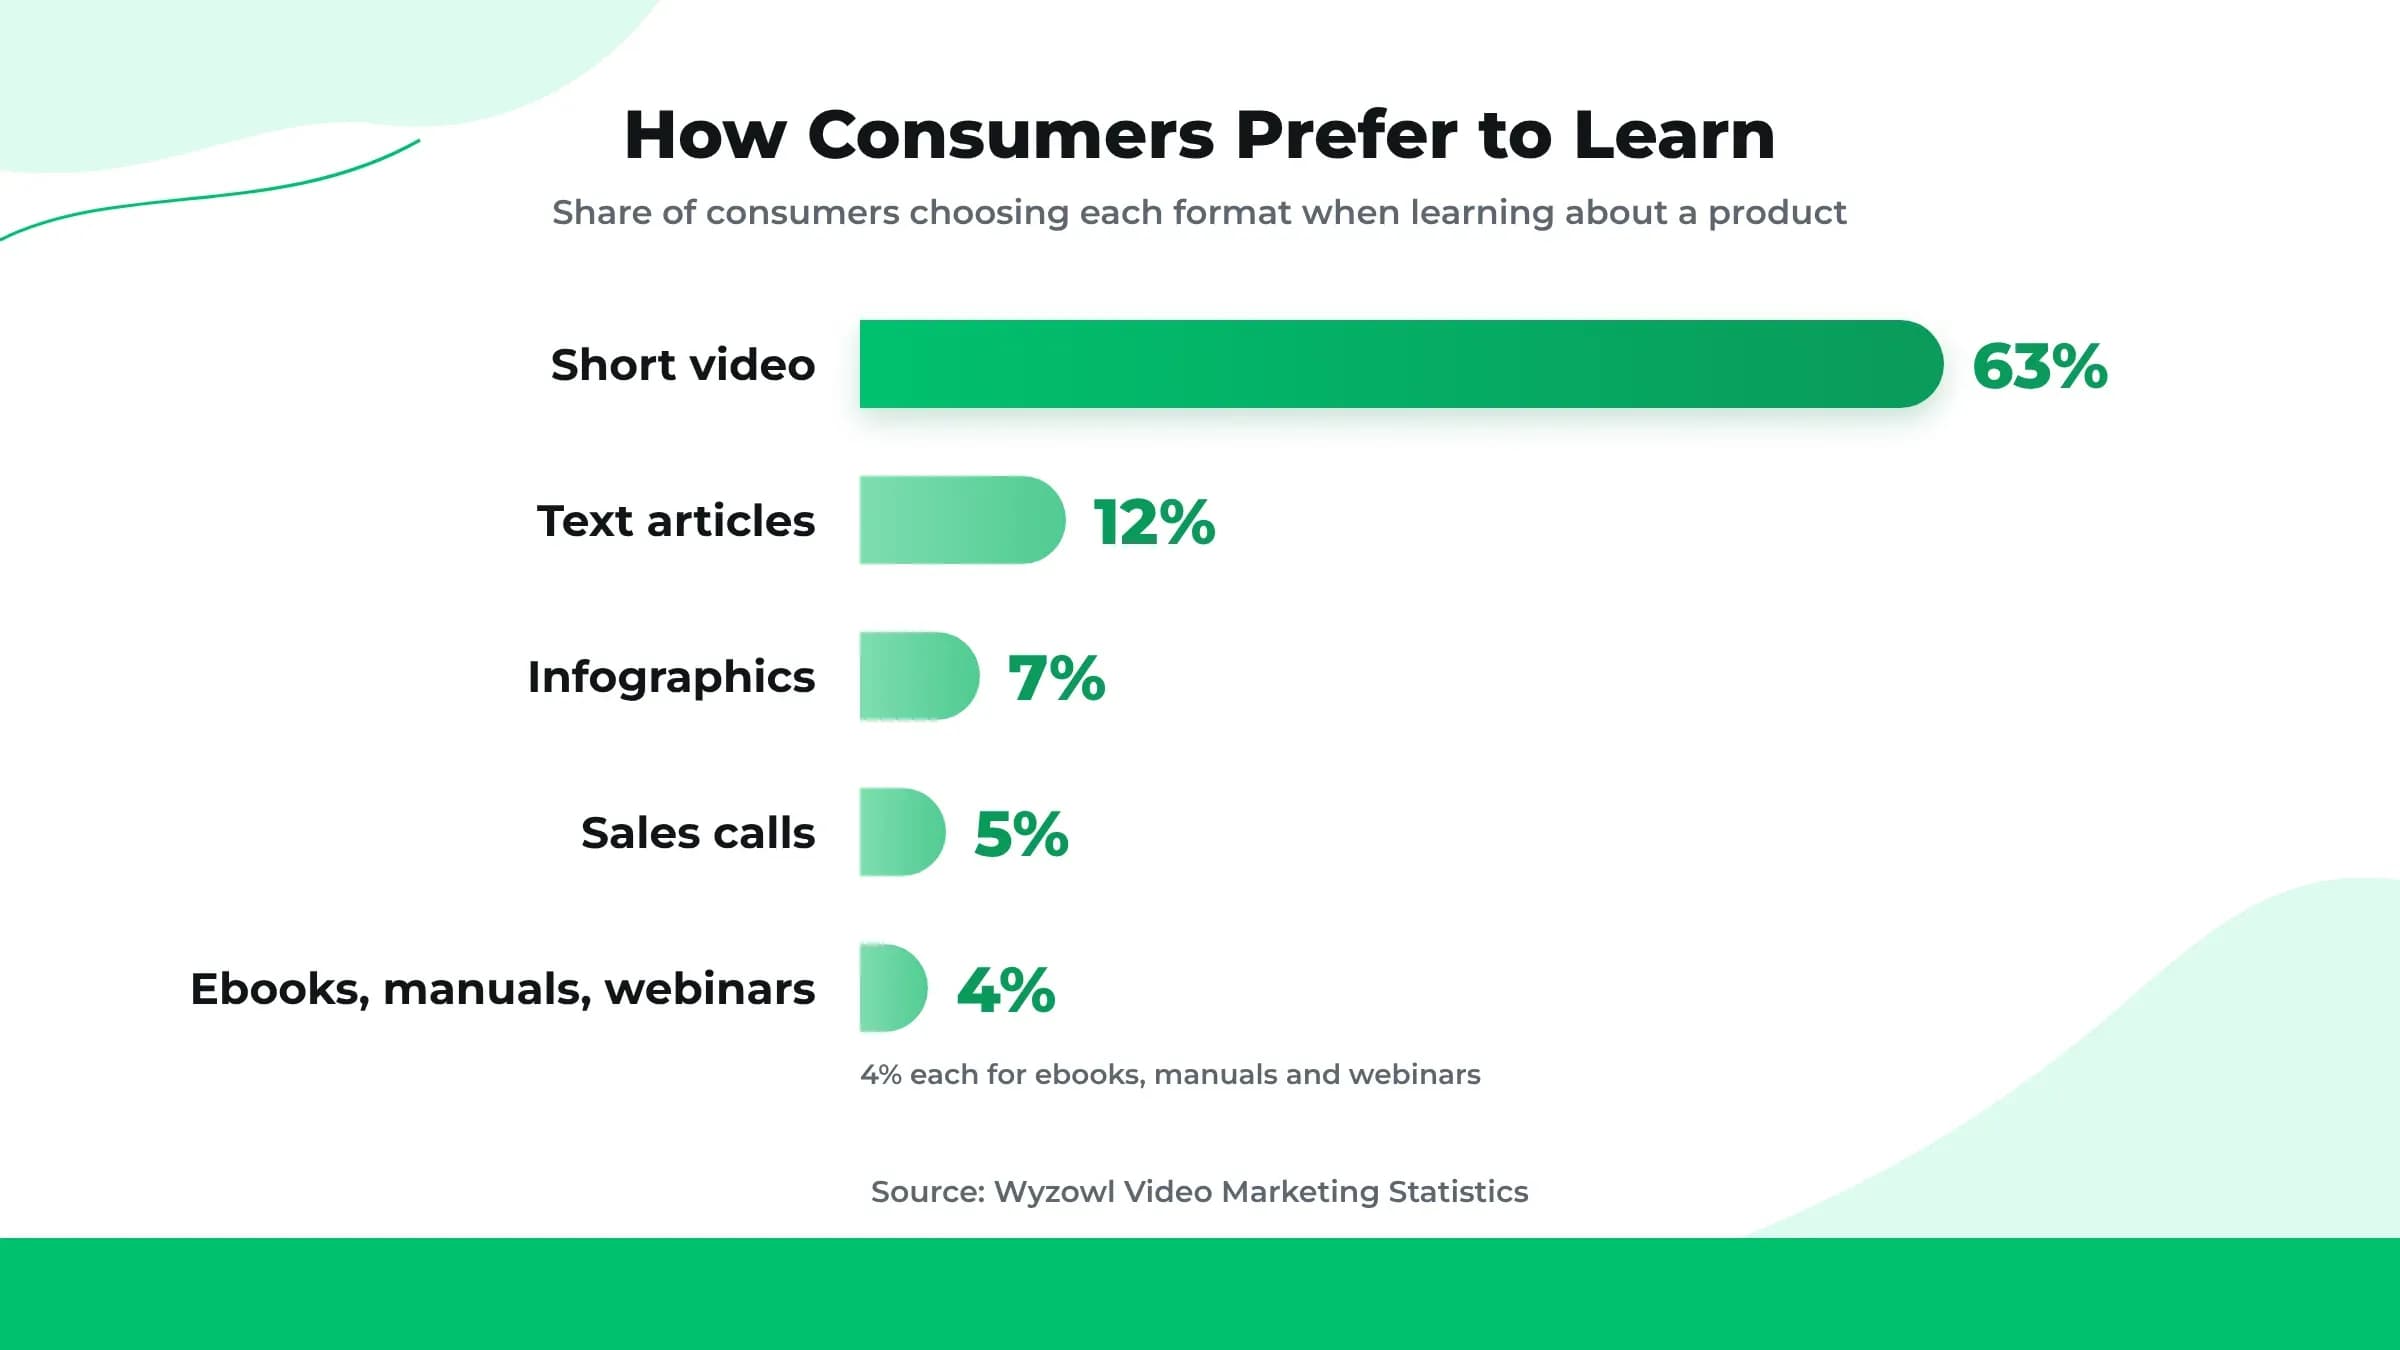
The preference for video as a learning format is very strong, which is exactly why creators chase millions of views so aggressively. Given a choice on how to learn about a product, 63% of consumers selected a short video. That answer beat all other choices by a large margin. Text based articles landed at 12%. Infographics landed at 7%. Sales calls landed at 5%. Ebooks, manuals, and webinars each landed at 4%.
The call for more video content from brands continues to grow. Data shows that 84% of consumers want more videos from companies in 2026. Industry reports show this figure stayed within an 8% range for the past 8 years.
Quality changes how buyers view a business. Reports show that 89% of consumers say video quality impacts their trust in a brand. That number fell slightly from 91% in the prior year. Still, it rose from 87% in 2024 reports. The data shifts in a small range every year without moving wildly.
Video Marketing Trends Statistics
The biggest video marketing trends this year center on AI. More than half of video creators now use artificial intelligence, and in just one year, AI tools went from a rare choice to the most popular choice.
A recent industry report shows that 63% of video marketers used AI tools to make or edit videos in 2026. This number was 51% in the year before. That is a jump of 12% in just a year. It is one of the biggest one year changes in the whole dataset.
Marketers expect this number to keep rising as AI tools get better, a trend Sprout Social has also flagged in its own platform research. However, this prediction is just an opinion from the team. It is not a measured fact.
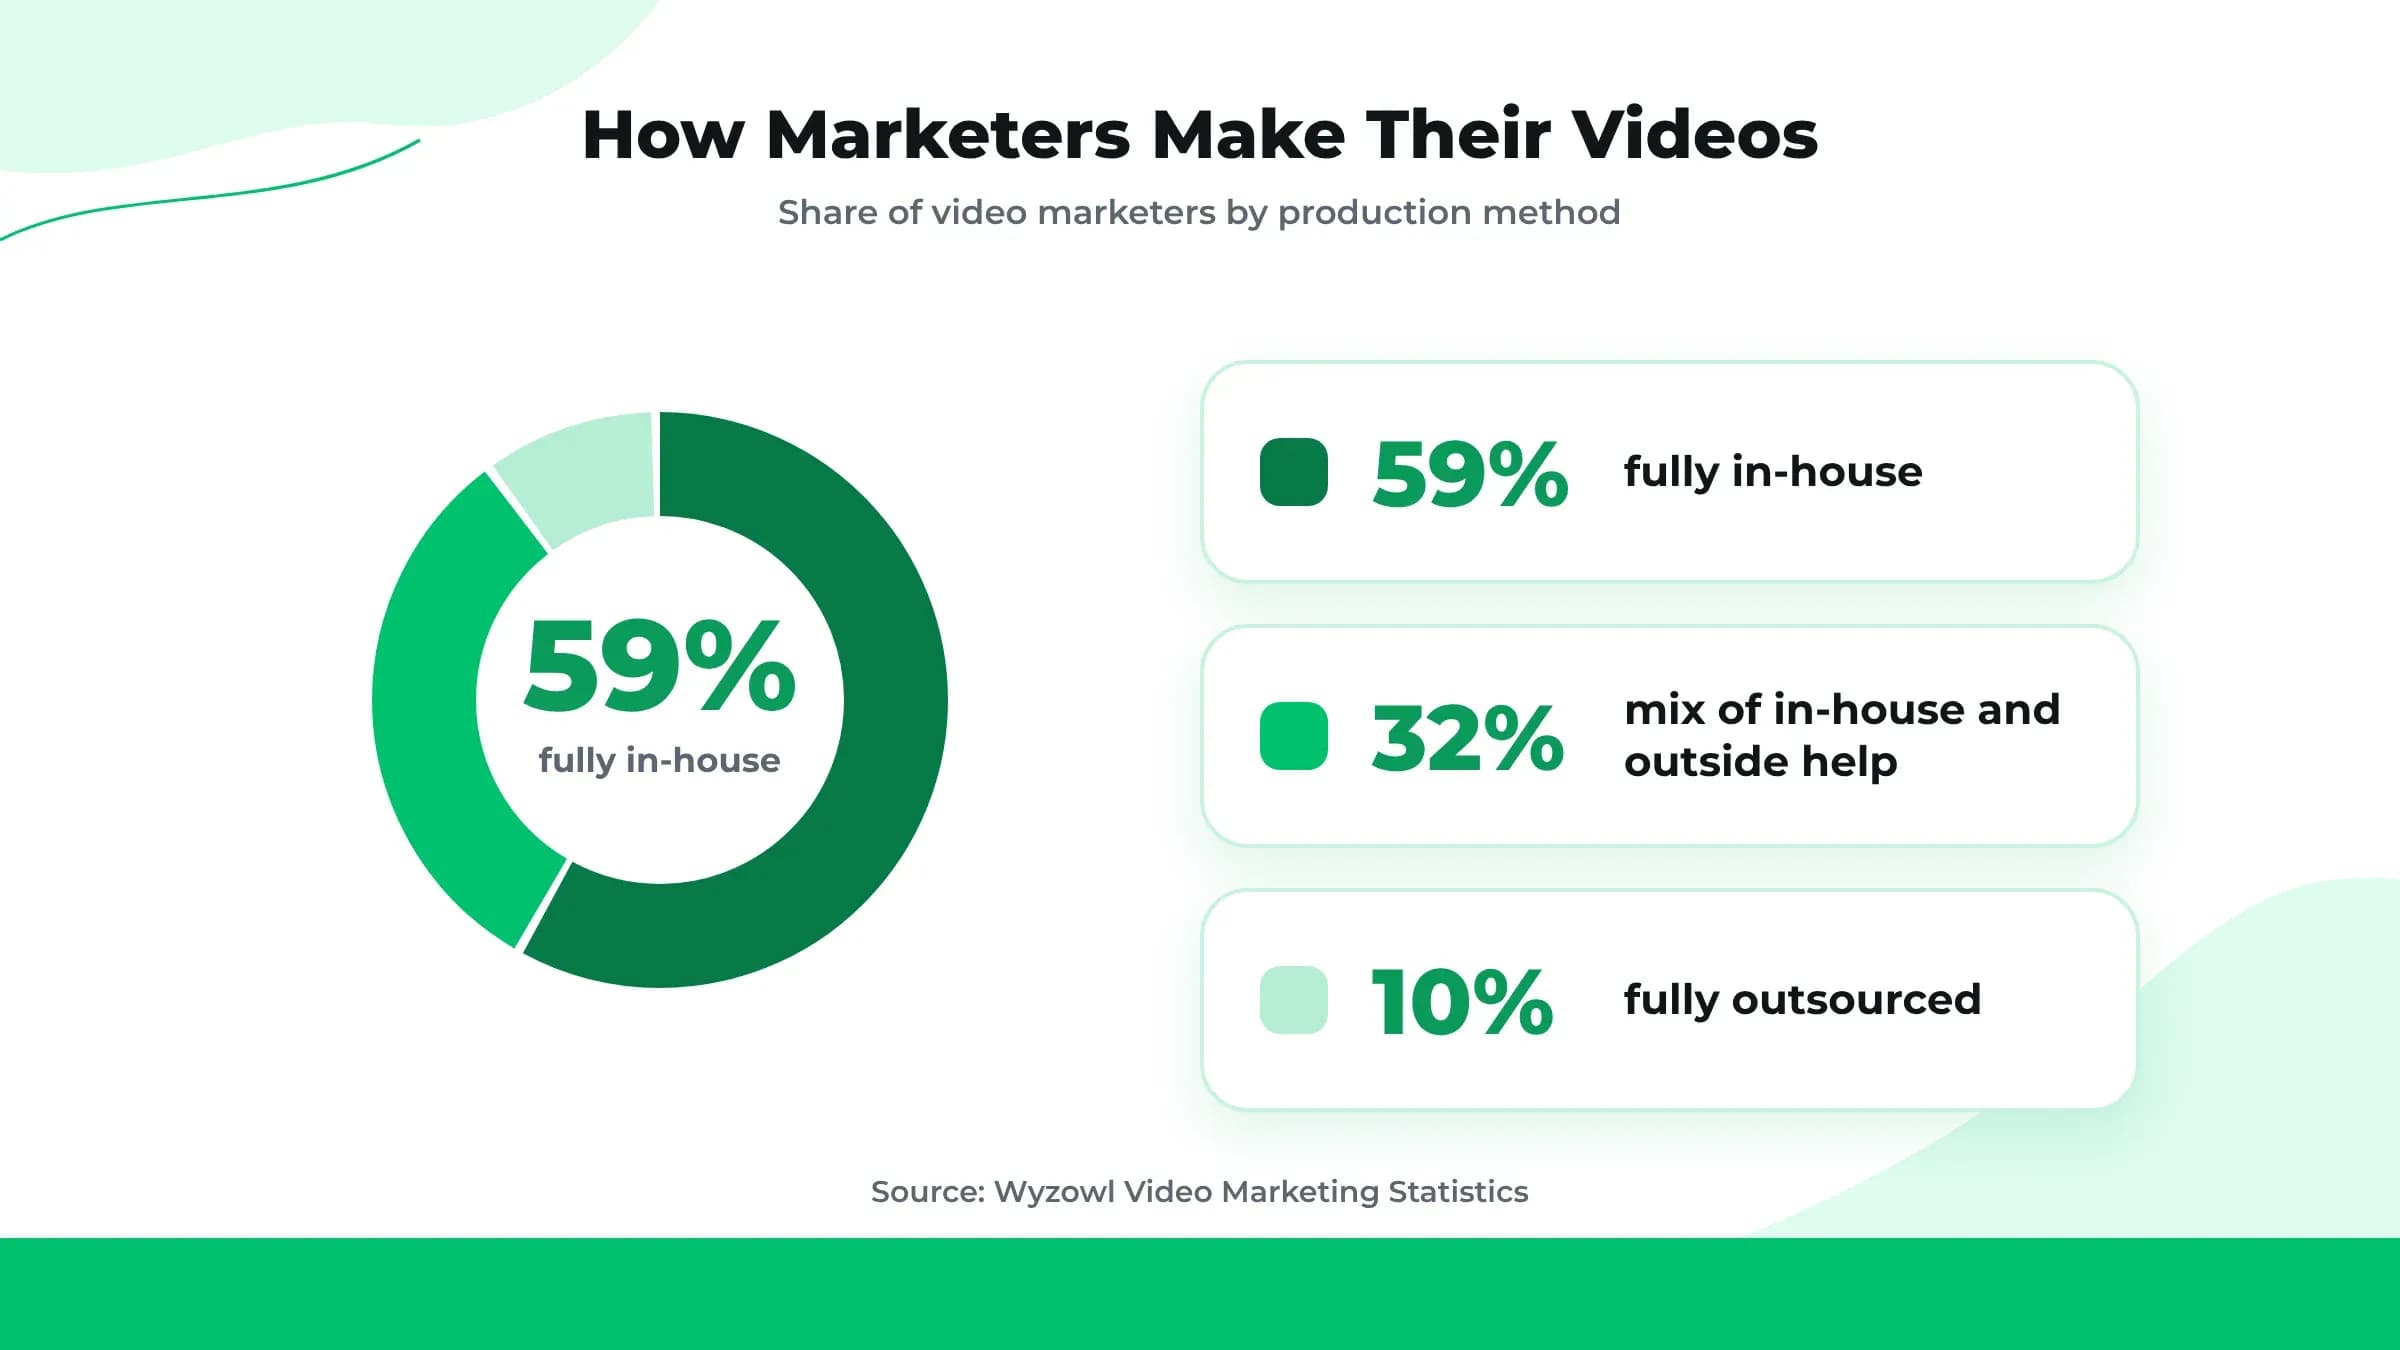
How teams make videos is changing much slower. In 2026, the survey showed that 59% of video marketers make all their videos inside their own company. Only 10% hire outside companies to do all the work. Meanwhile, 32% use a mix of inside staff and outside help. That means a combined 42% of businesses get outside help for at least part of their work. Still, making videos fully inside the company remains the most popular single choice.
Real people on camera stay at the top. The report found that 51% of video marketers mostly make live action videos with real people. Animated videos come in second place at 23%. Screen recorded videos come in third place at 19%.
What Video Content Gets Made For
Companies make videos for many different purposes. Recent reports rank these video types by how many marketers create them. Social media videos take the top spot at 69%. This makes social media content the most popular choice. Explainer videos follow closely at 68%. Testimonial videos come next at 57%.
The rest of the list covers many different business needs:
Employee onboarding videos sit at the bottom of the list. They focus mostly on internal staff.
This wide spread matters for one big reason. No single video type rules the entire list. Businesses use video for many jobs at once. They make videos for public marketing. They also make videos for staff training. Companies do not focus on just one single goal.
Video Marketing Statistics by Platform
Video statistics by platform reveal that usage and success are two different things. Earlier mentioned reports track both numbers separately for each platform.
These numbers come from industry surveys conducted in late 2025 with 266 people.
YouTube leads all platforms in usage and success, and buyers often ask whether you can buy views to speed that up. 82% of businesses use YouTube. 69% of video marketers find it effective. Instagram and Facebook both show effectiveness scores over 50%. LinkedIn hits 50% effectiveness. Webinars reach 42% effectiveness. TikTok stands out as an exception. 40% of marketers use TikTok. However, only 29% find it effective. This makes TikTok the least effective major platform in the survey.
Industry reports highlight a big opportunity gap for Snapchat and X. Both platforms have millions of regular users. Yet marketers struggle to find success in them.
TikTok shows a unique pattern. Most platforms with high usage also show high success. Marketers keep using channels that work for them. TikTok breaks this rule. 40% of marketers use TikTok. Yet only 29% report good results. Many marketers try TikTok even though they have not found high success there yet, a gap Sprout Social's own YouTube research frames as part of a wider platform-effectiveness divide.
Video Length and Format Statistics
Shorter videos perform better than longer videos. However, the shortest videos are not always best. Earlier mentioned reports show that 71% of people believe videos between 30 seconds and 2 minutes work best. This represents a clear majority view.
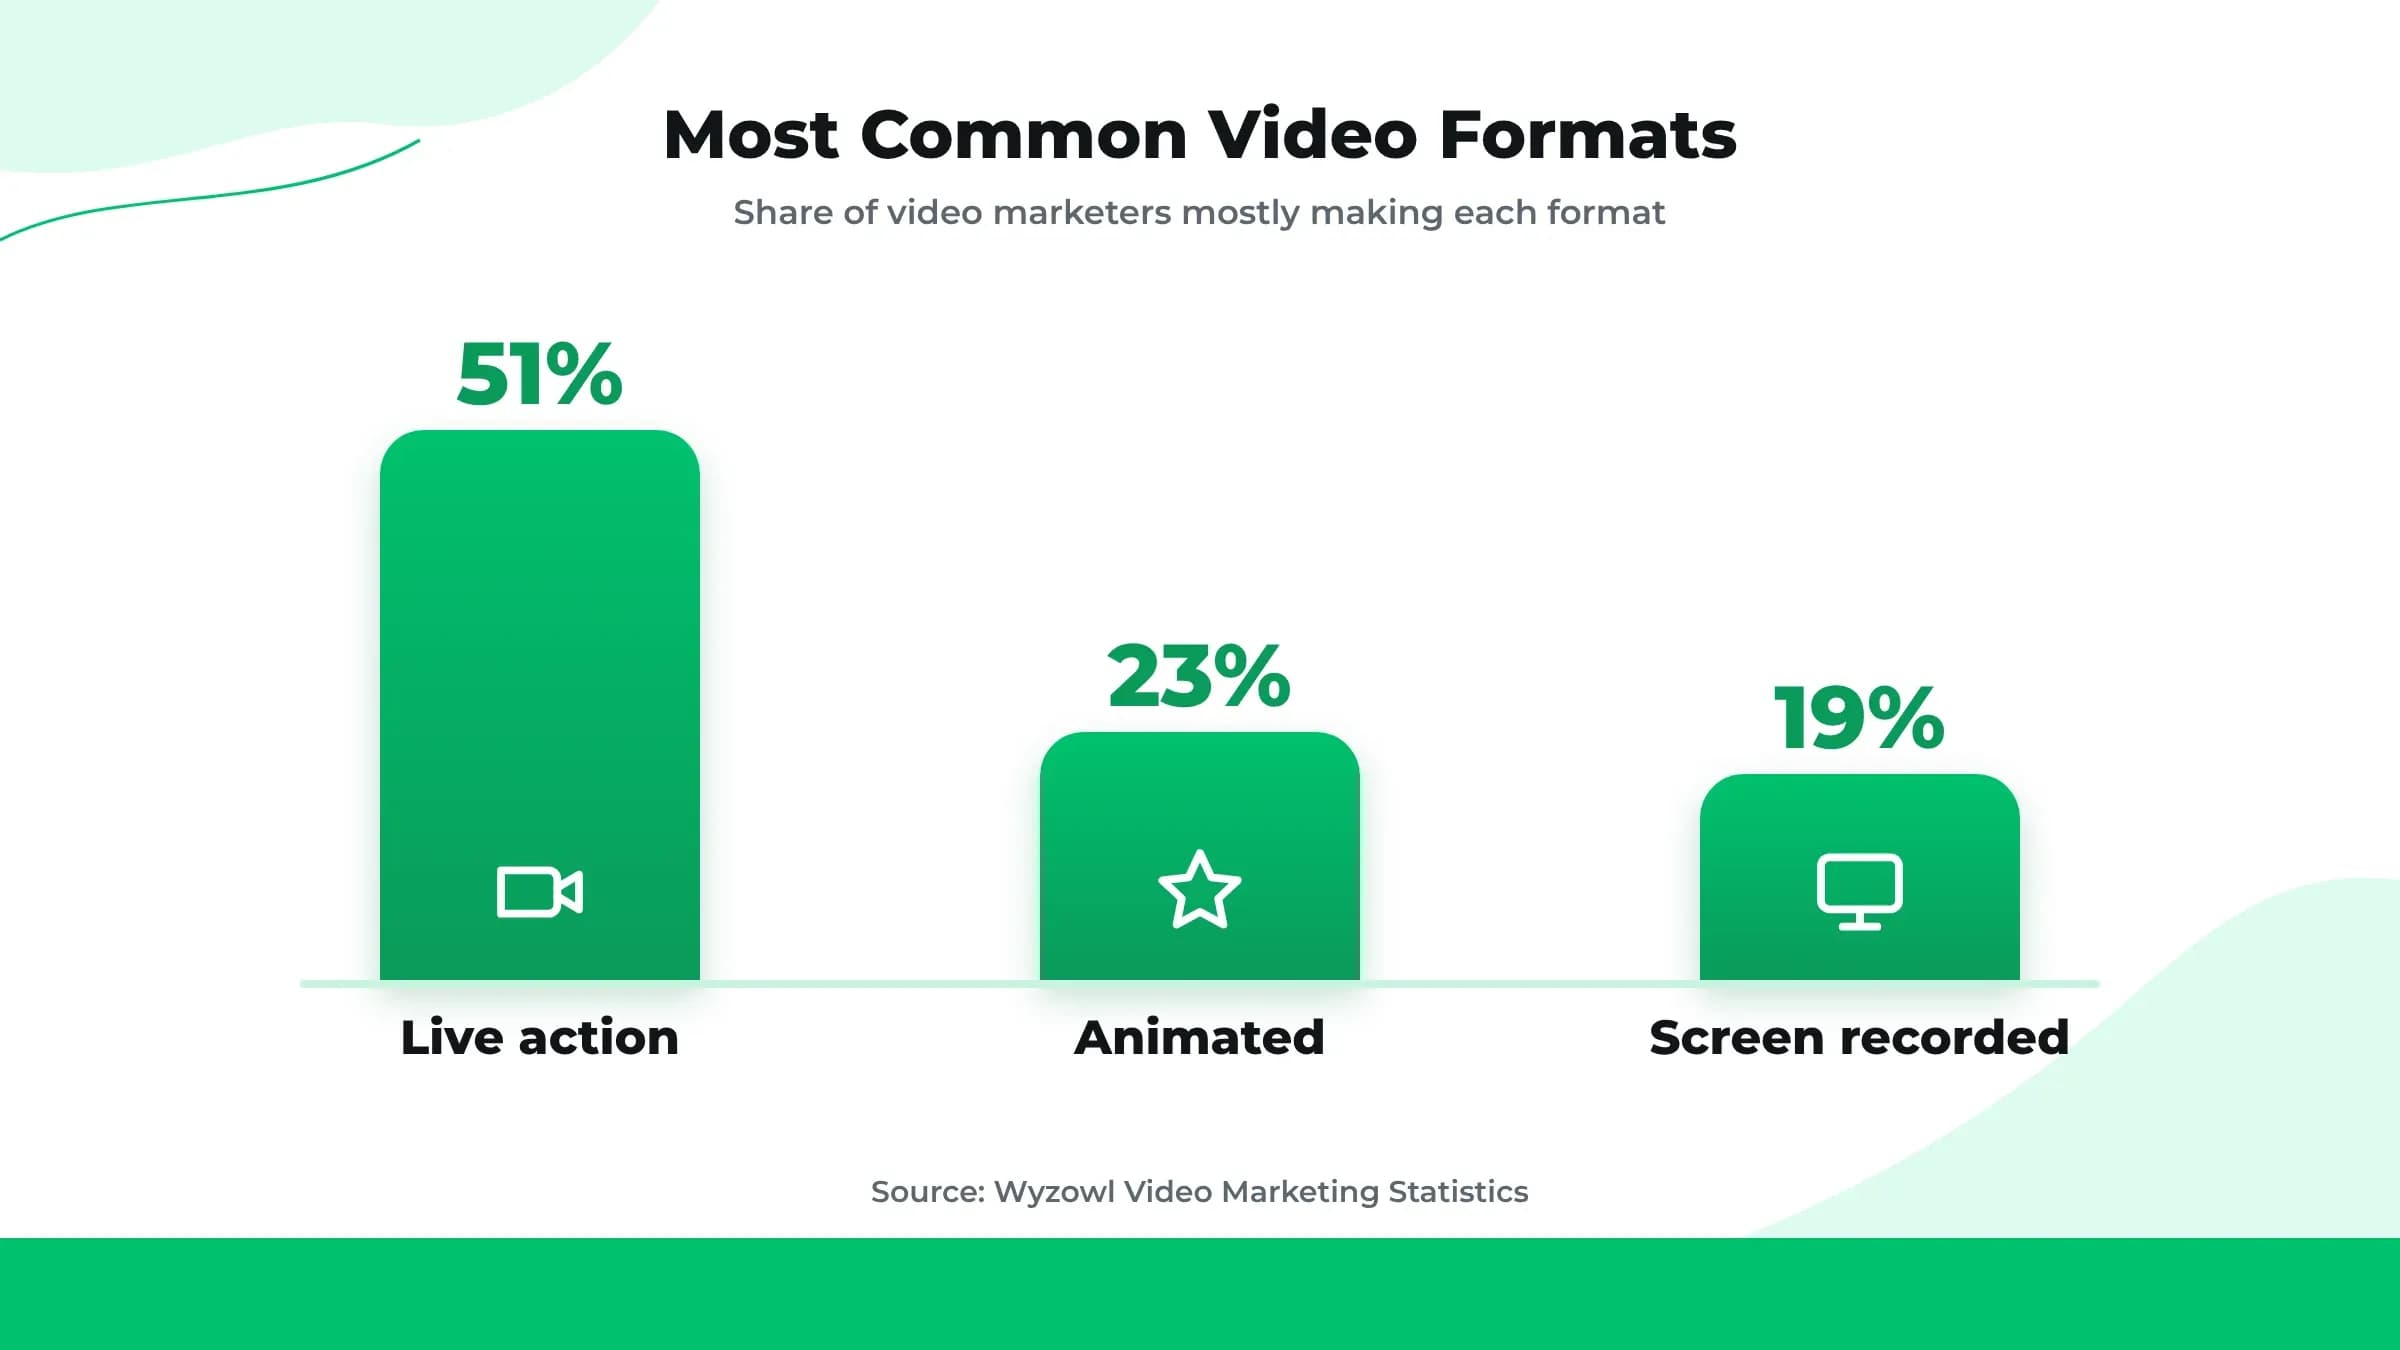
Format choices favor real life videos over animations, a preference Statista's platform data also reflects. Live action video is the most common format. Industry reports show that 51% of video marketers make live action videos. Animated video comes next at 23%. Screen recorded video comes in at 19%. People often use screen recordings for software demos and lessons.
How companies make content is also important. The same reports show that 59% of video marketers make all their videos in house. Another 32% mix in house work with outside helpers. Only 10% rely only on outside vendors. This shows that handling production inside the company has become the main strategy.
Video Marketing Conversion and Sales Statistics
These video conversion statistics link directly to shopping choices for both buyers and businesses. 83% of video marketers say video directly increased sales for their business. This statistic focuses specifically on direct sales instead of general feelings about return on investment.
The numbers on the buyer side are just as strong, which is part of why creators look into earning money from views in the first place. Recent surveys show that 85% of consumers say watching a video convinced them to buy a product or service.
A separate number looks at mobile apps and software specifically. Data shows that 80% of consumers bought or downloaded an app after watching an app demo video.
These statistics match each other very well. Marketers report high sales from video. Consumers report buying products because of video. Both sides show the same clear trend from two different points of view.
Conclusion
The recent video marketing statistics show a clear and steady story. Companies use video content heavily today. Most marketers get a strong return on their investment. Shoppers also say video clips directly shape their buying choices.
Current survey numbers show real changes happening in the market. Reported returns dropped slightly from an all time high level. At the same time, the use of AI tools jumped very fast. You should watch both trends closely instead of assuming they will stay the same.
You can use these video marketing statistics to measure your own progress. The numbers offer a helpful baseline for comparison. They do not offer a promise of success for every single business.
Frequently Asked Questions
What is video marketing?
Is the Wyzowl video marketing survey a trustworthy source?
Do I need a large budget to start with video marketing?
What type of video should a beginner brand create first?
How often should a business post video content?